Spotify extension to use with Tableau Desktop.
With this extension, you can create playlists based on datapoints you select from a dashboard. This extension was created to demo how the Tableau Extensions API can be used with Tableau Desktop and Spotify. It has limited functionalities and is made to be a starting point for connecting Tableau and Spotify.
More improvements to come in the future.
- Spotify data - obtainable by using this awesome tool.
- Pre-Release version of Tableau Desktop - follow steps to sign up and download copy on this page.
- Node.js - you can get Node.js from https://nodejs.org
- This extension currently does not support obtaining Spotify oauth tokens (work in progress), so you will have to manually get an oauth token from spotify. You can get it from the Spotify website by going here. Click on 'GET OAUTH TOKEN' and checkmark 'playlist-modify-public' before requesting (login required). Copy/paste the token to the token variable in spotify.js.
var token = '';-
Copy
spotify.trexto~\Documents\My Tableau Repository (Beta)\Extensionsso it will be available in Tableau. -
Open a command prompt window to the location where you cloned this repo.
-
Make sure you're in the
.\spotify-extensiondirectory. -
Run
npm install(only the first time), thennpm start. -
Launch the pre-release version of Tableau Desktop. Create a new dashboard, and you should now be able to drag and drop the Spotify extension.
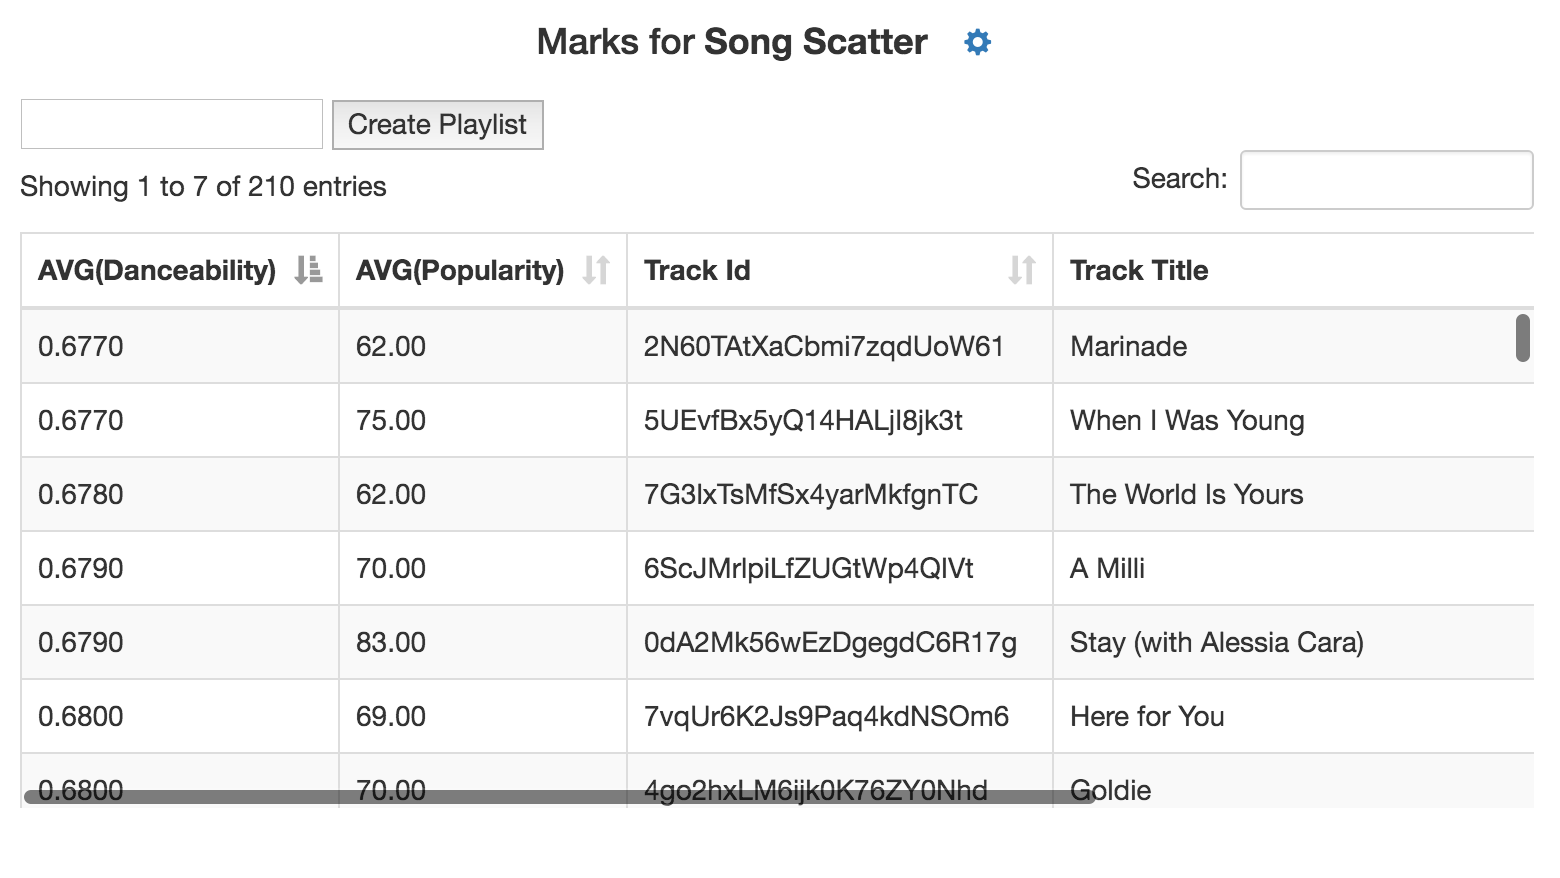
- When making a sheet in Tableau Desktop, you must include the 'Track Id' dimension so that it shows up in the datatable in the extension window. Playlists are created by adding each individual track, so make sure that the datatable has one row for each track. Example of this:
-
You also need to drag and select datapoints for it to be recognized by the extension. Best use case is to have a scatter plot with all tracks on the viz (e.g. plot popularity vs. danceability of all songs).
-
Most of the code is adopted from the tutorial included in the Extensions API SDK. The tutorials and the 4 other samples are very helpful in learning how to use the Extensions API.
