Multiple projects for debugging sample.
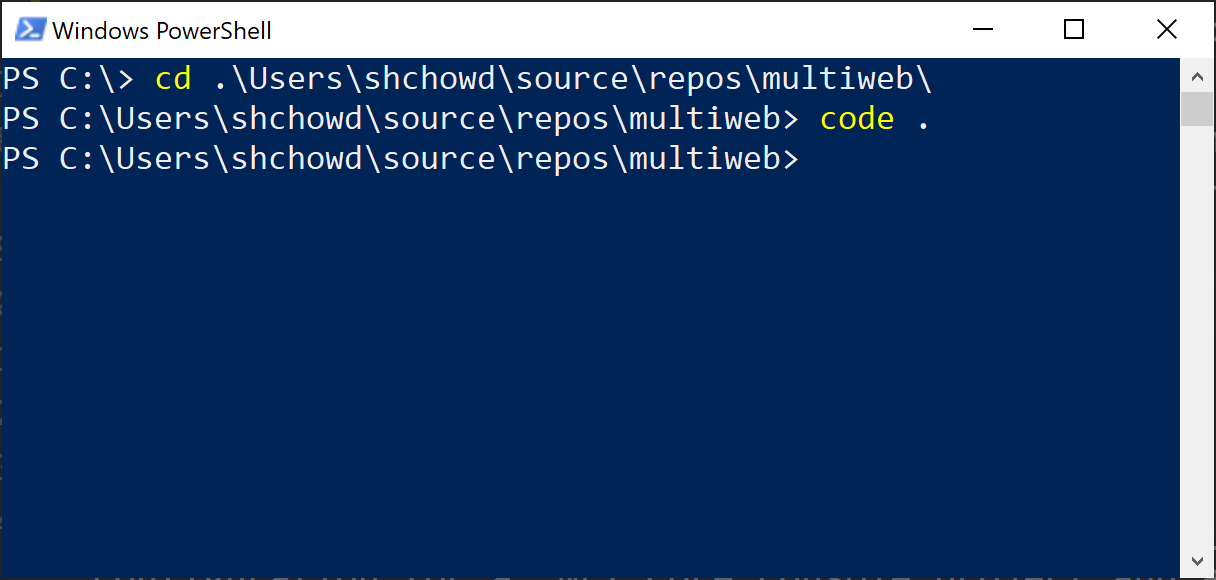
Launch VS Code with the project root as the current working directory. One easy way to do this is to type the word "code" followed by a dot "." at a Command Prompt, Powershell window or Windows Terminal.
Powershell/Terminal Command:
code .
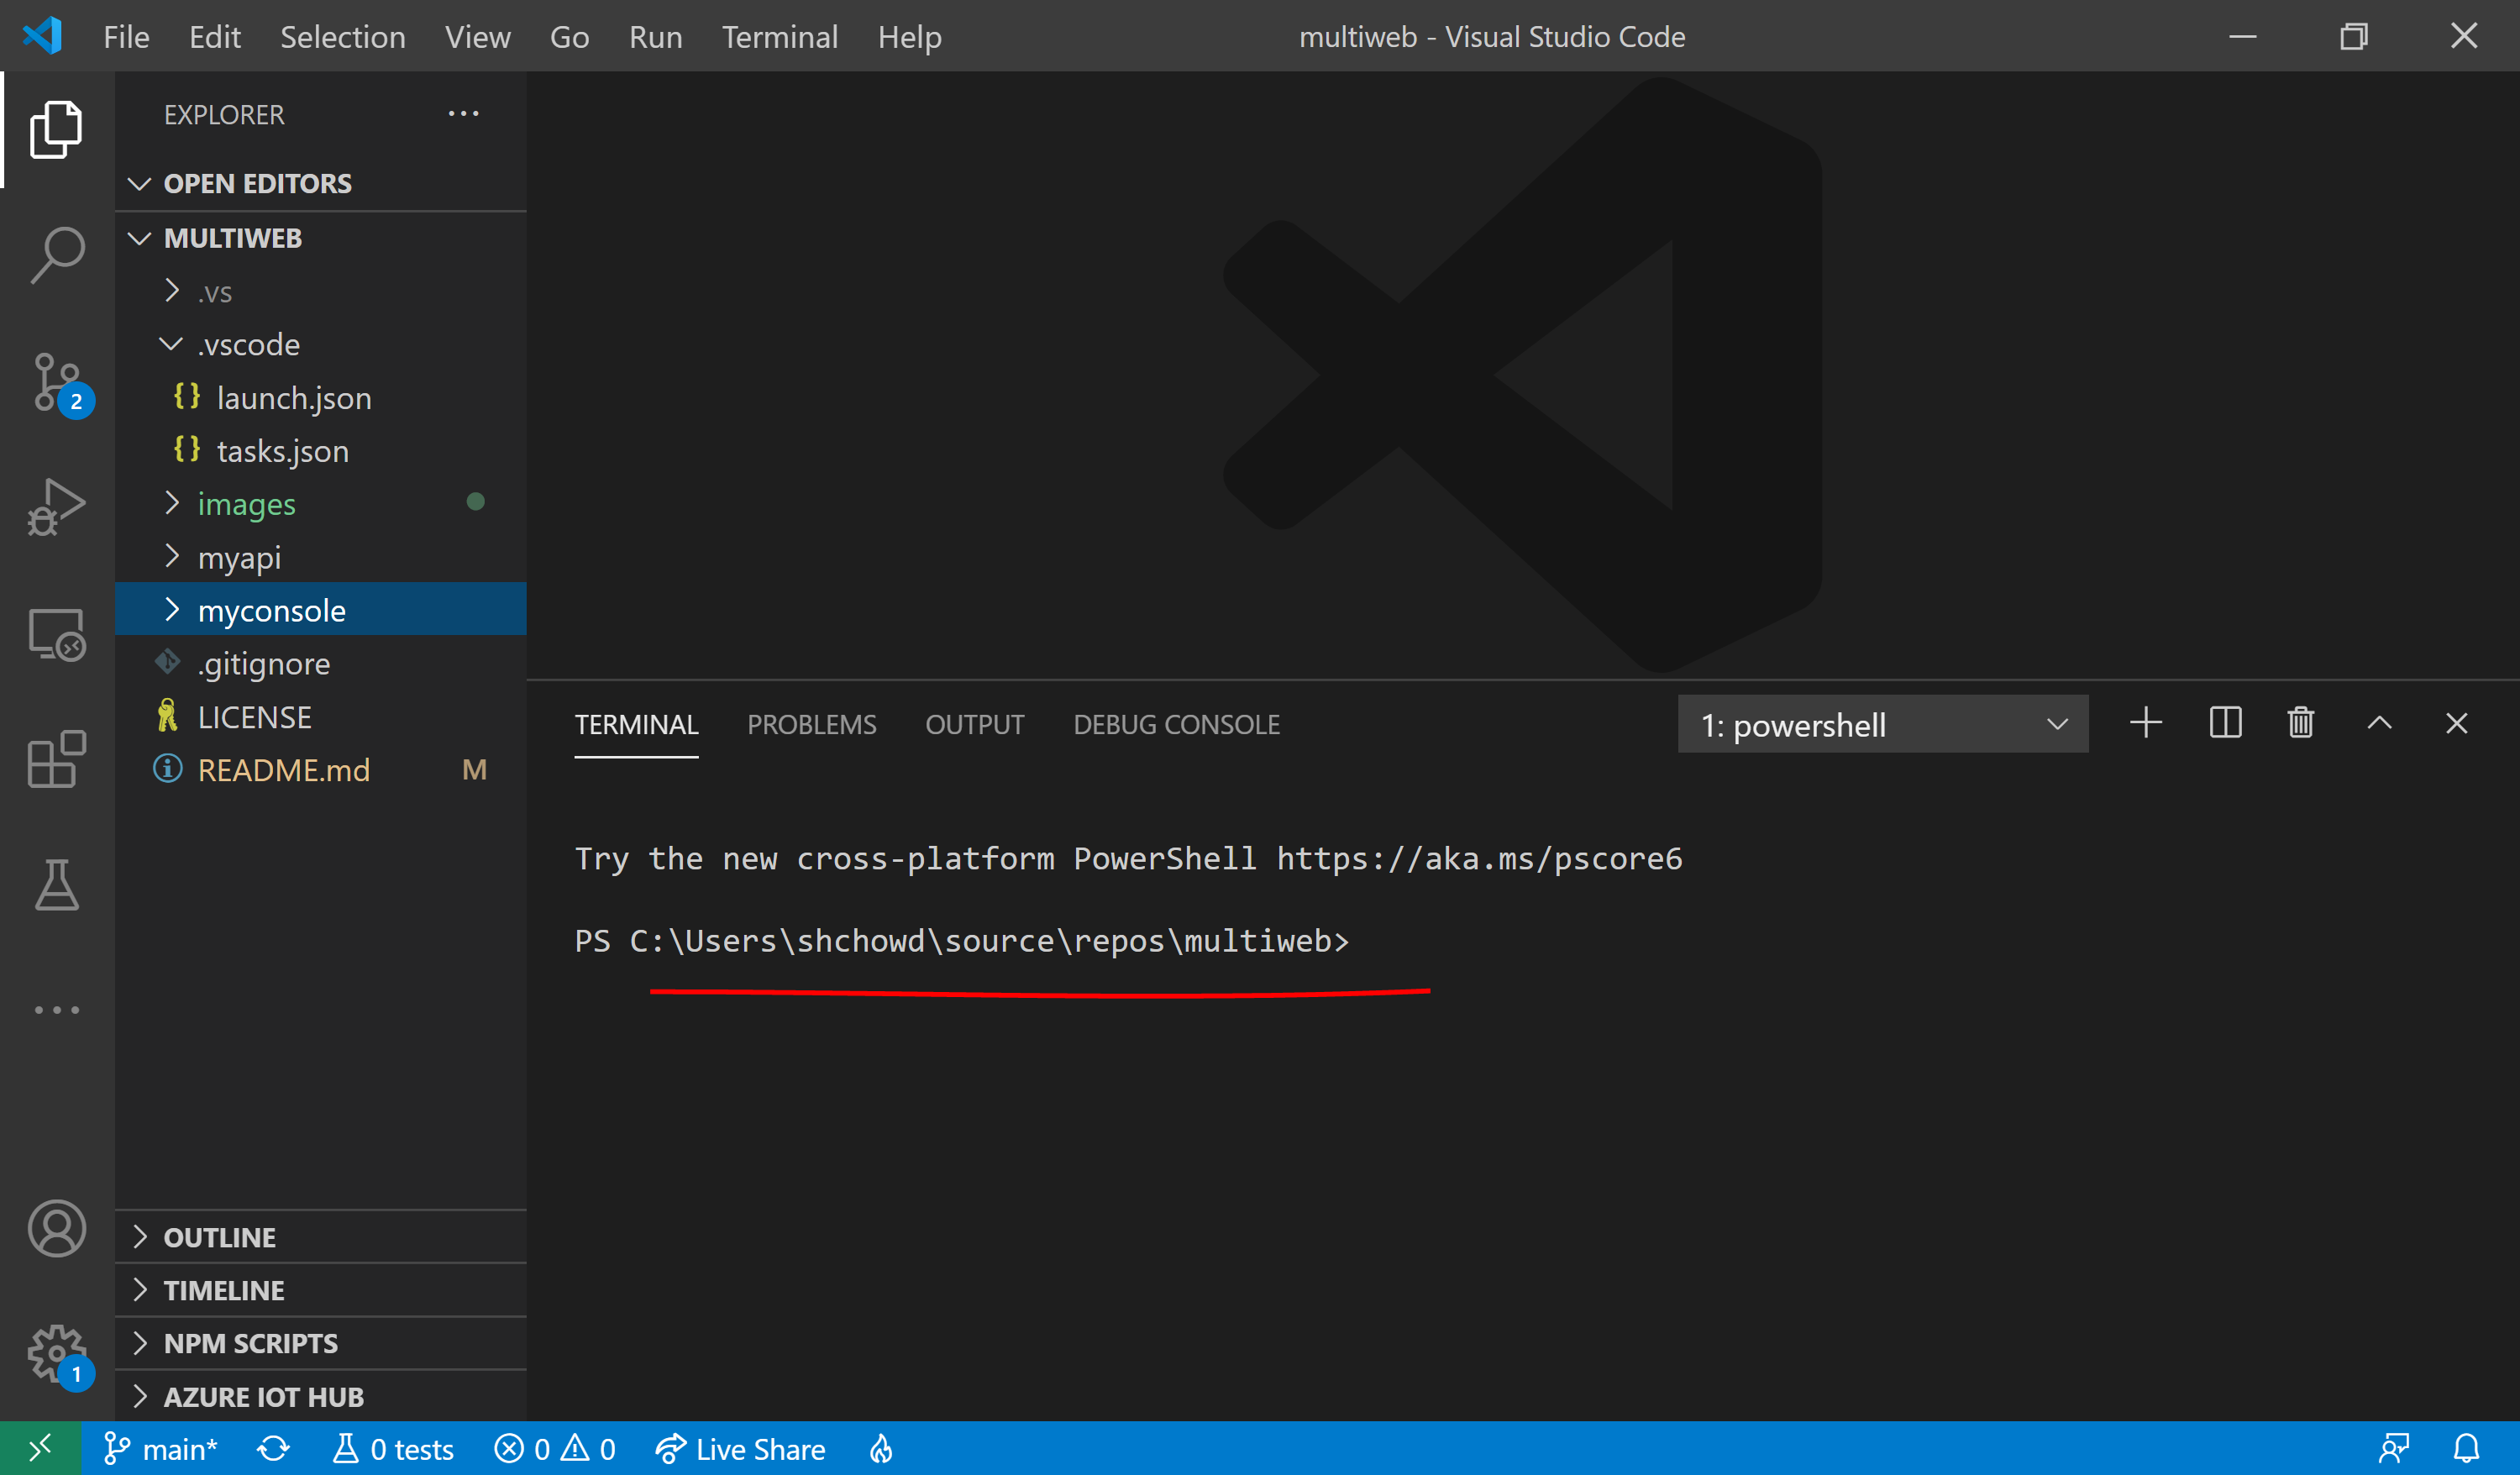
If you already have VS Code open, use the built-in Terminal (Ctrl+`) to change the current directory to the project root.
In either case, you should end up with VS Code open with the Terminal open in the correction location (project root).
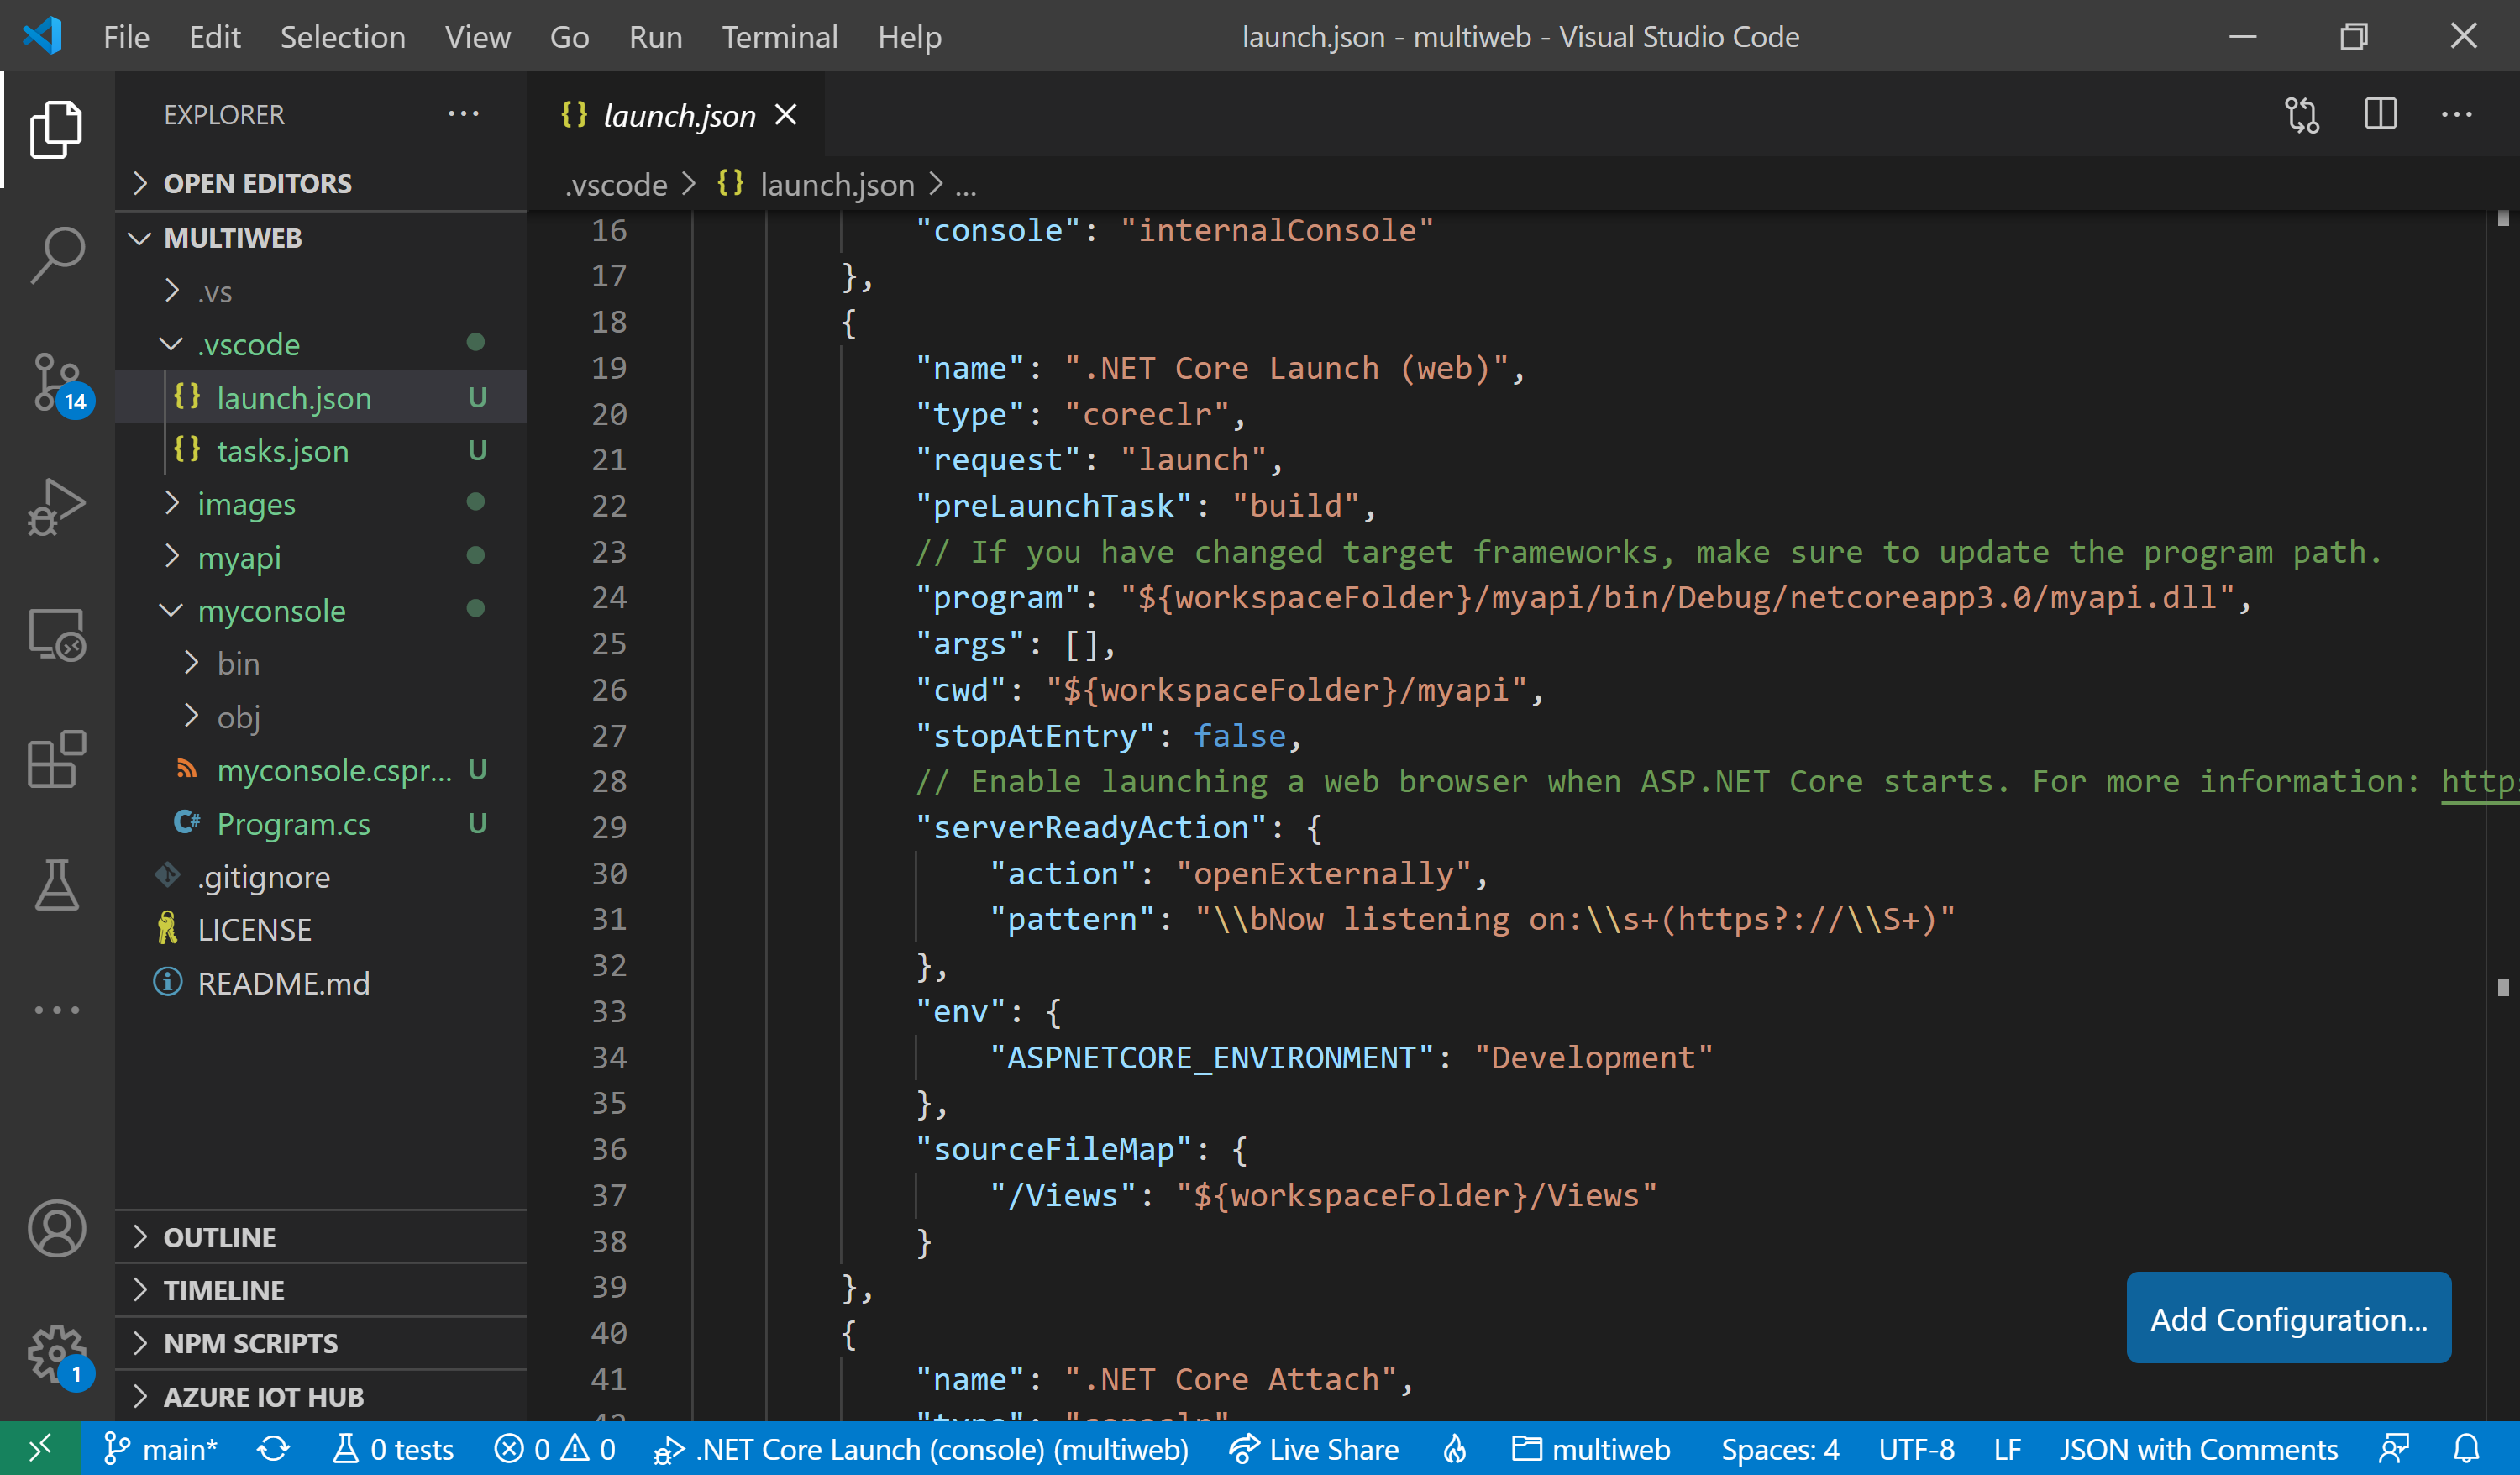
This project contains launch.json configuration for a .NET Core console project and a Web API projet.
Console Project Launch Configuration:
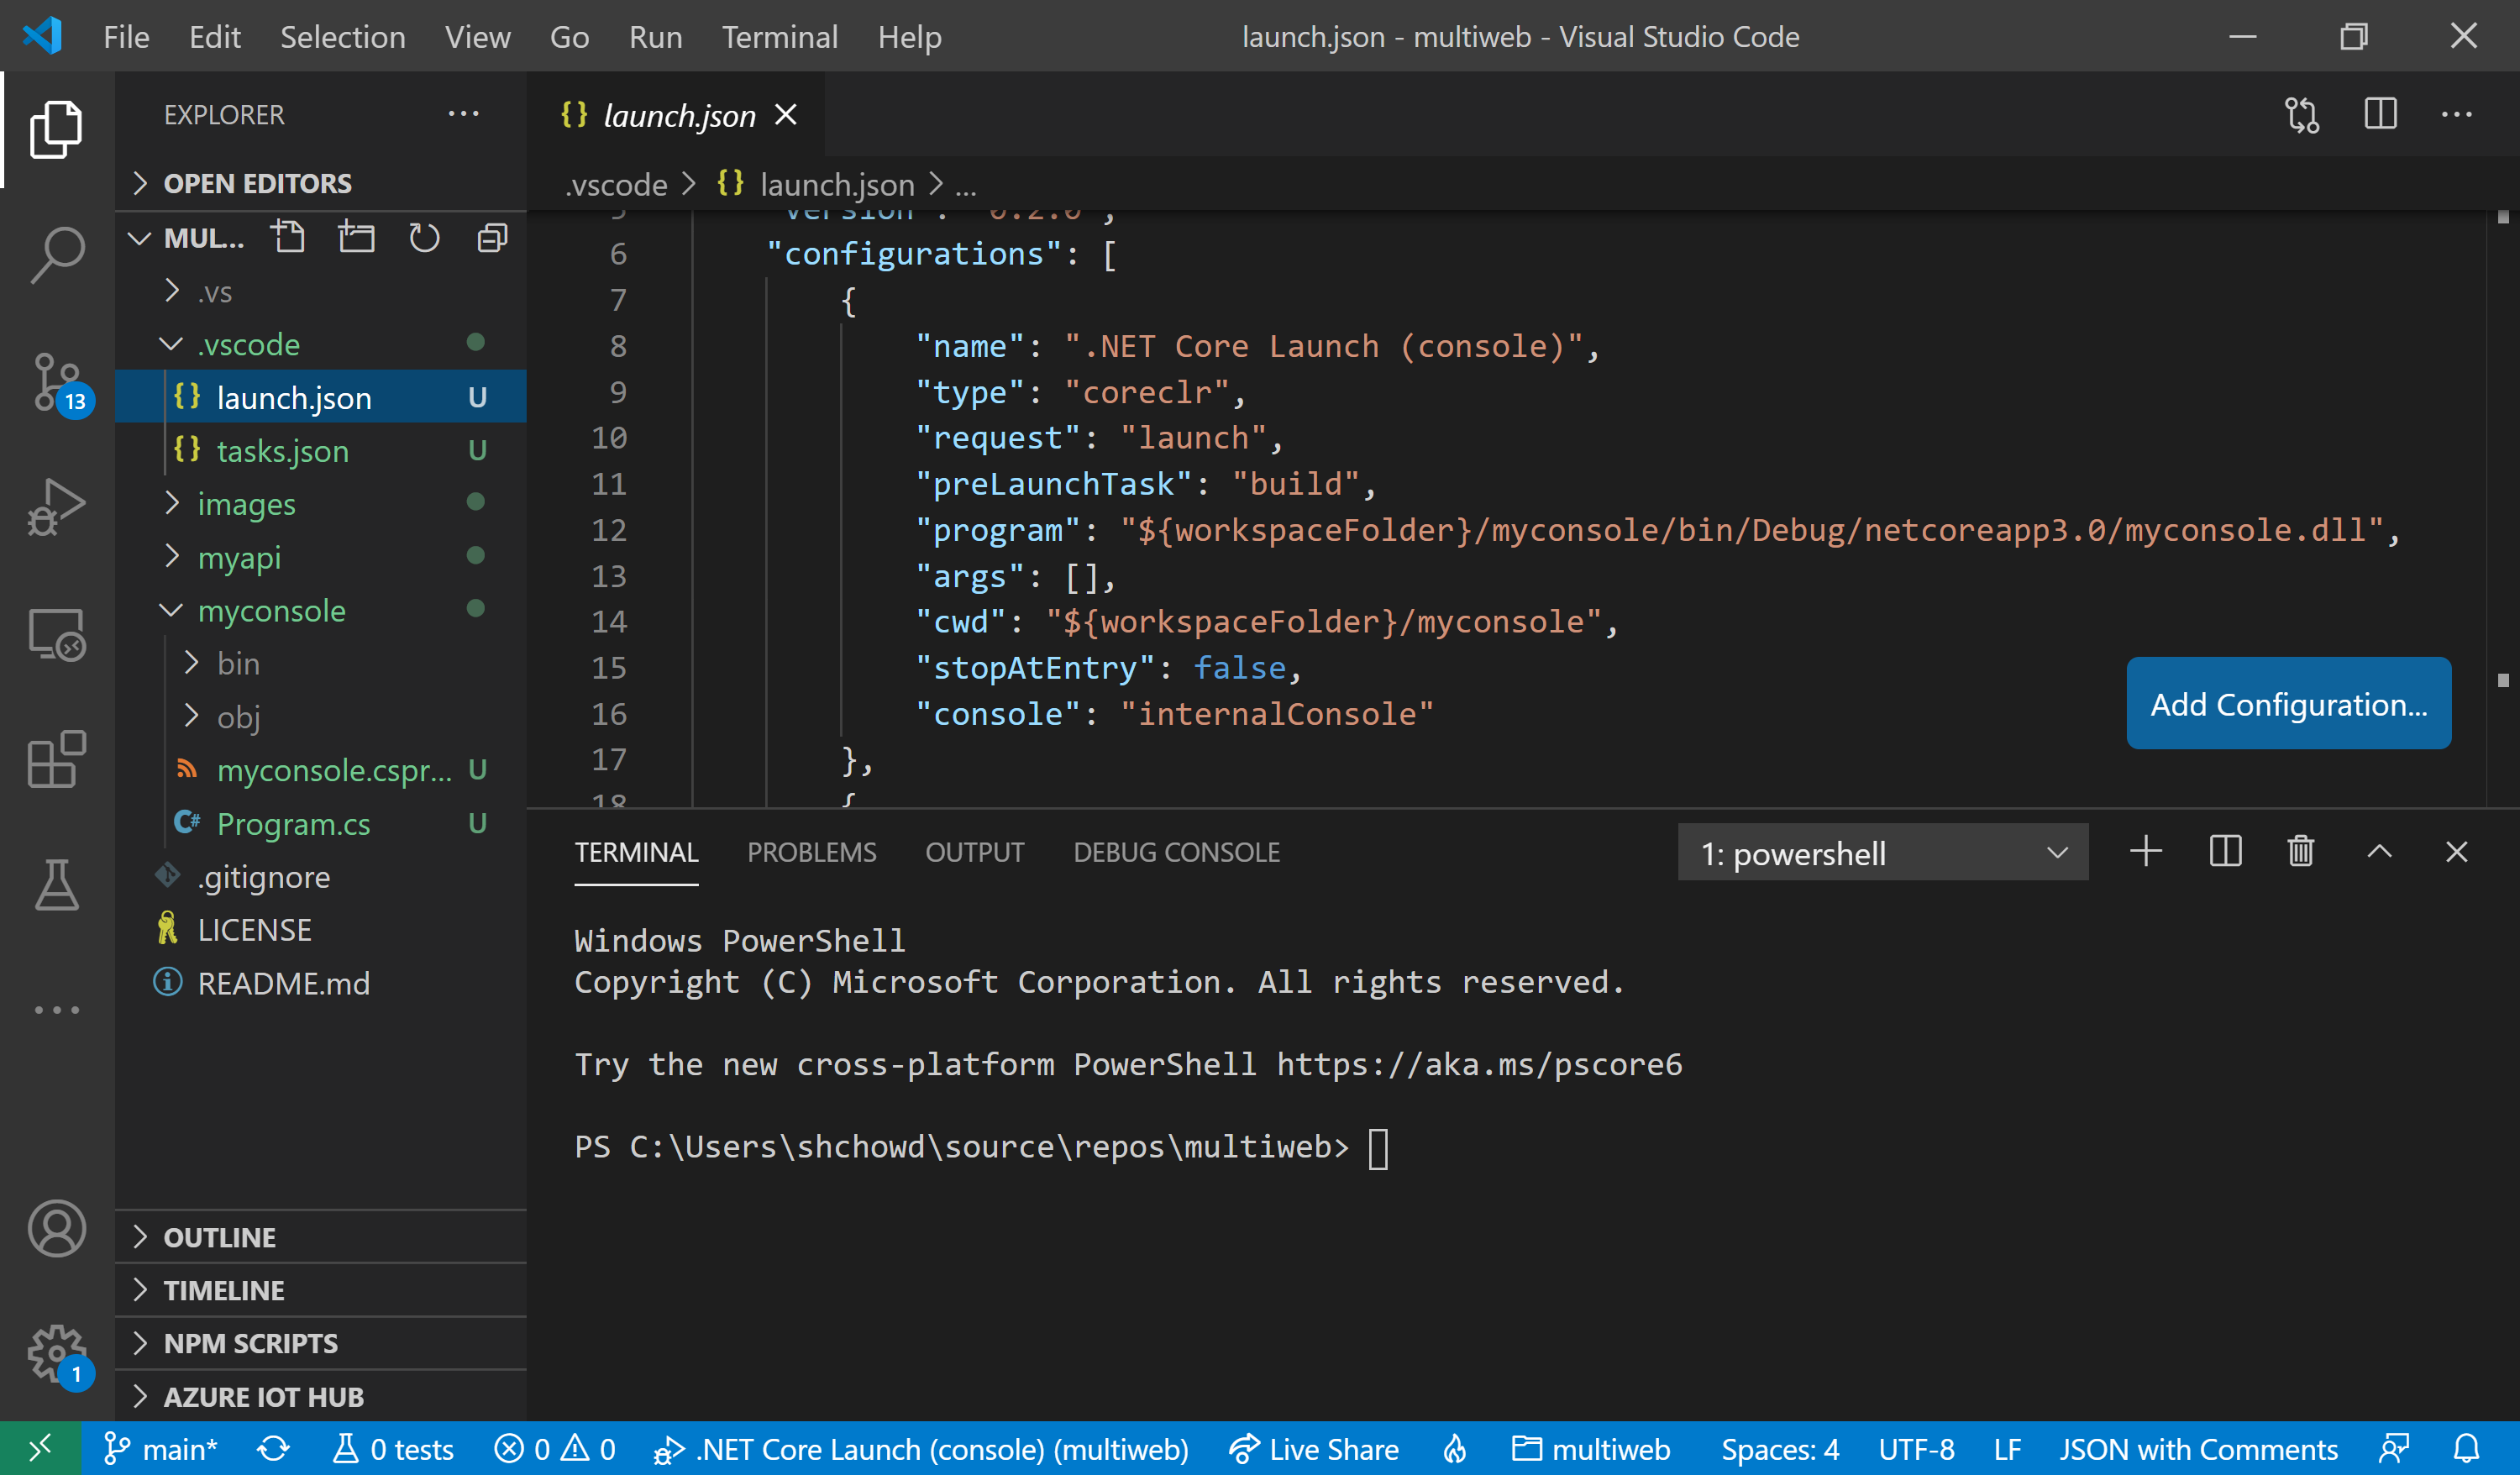
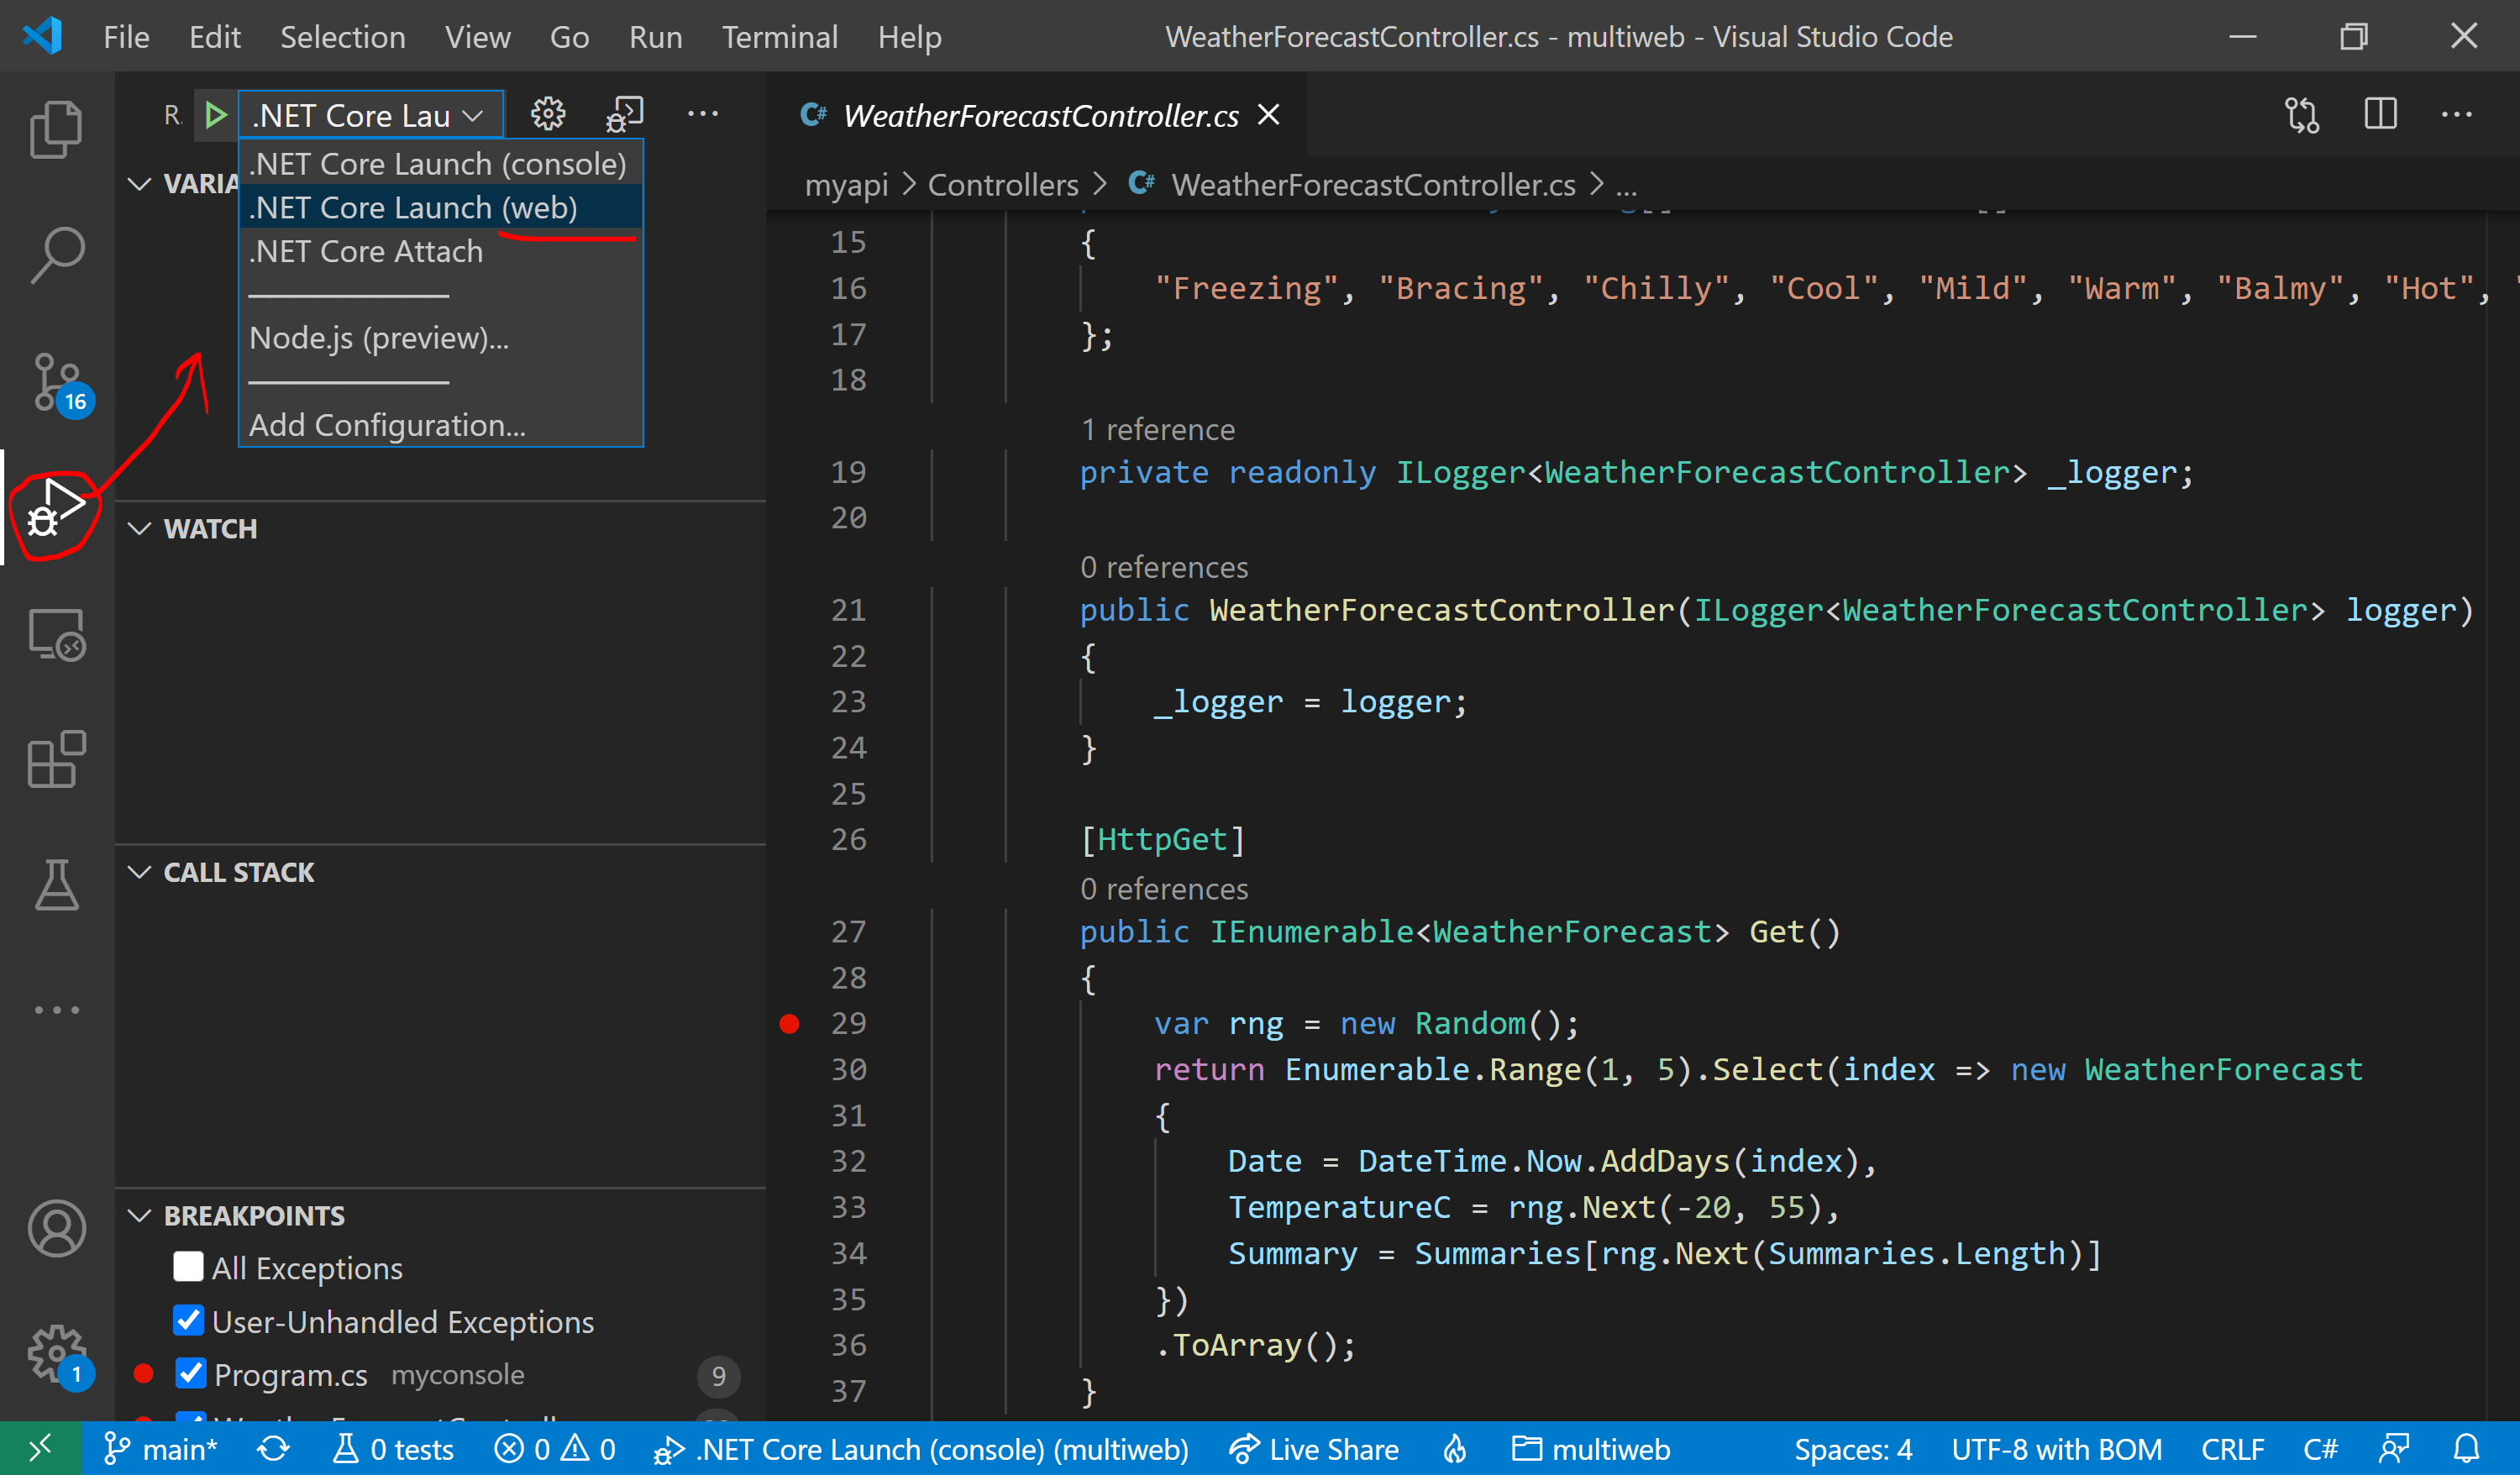
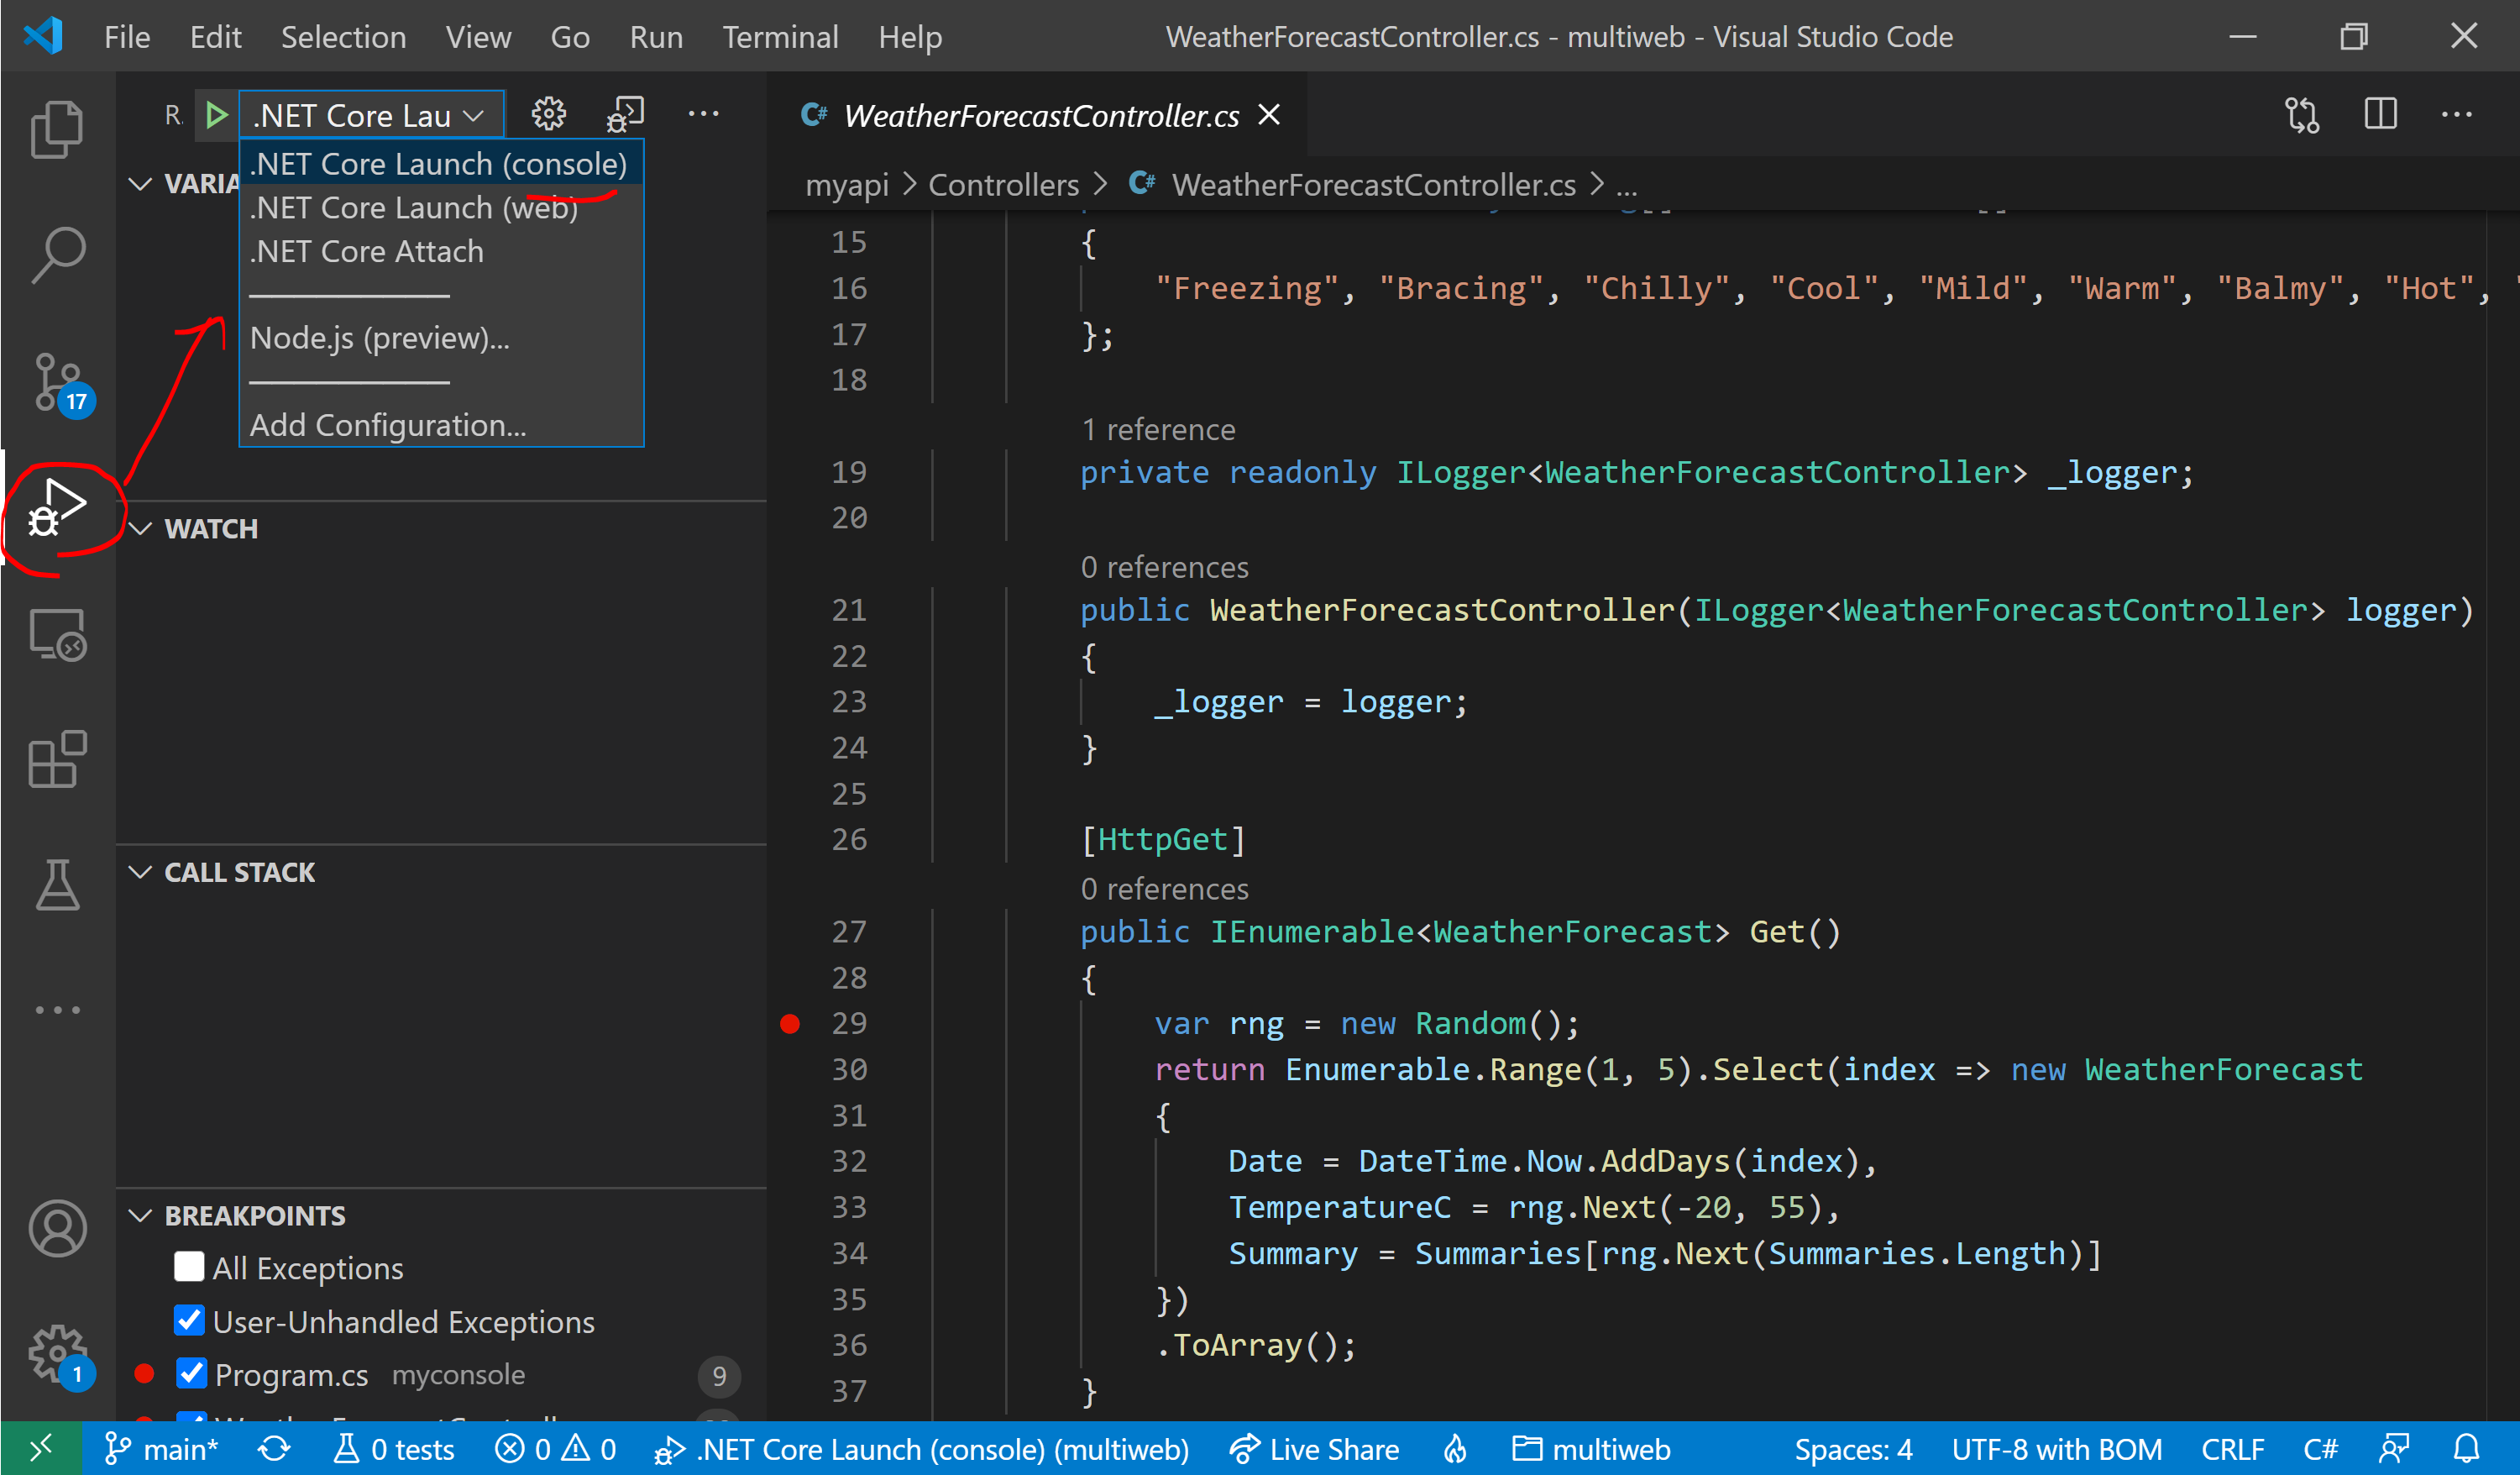
In the Debug Panel of VS Code, observe that you can see both configurations, ready for launch.
Console Project in Debug Panel:
In the code for each project, set a breakpoint that's easy to identify.
e.g. Inside Get() method within WeatherForecastController.cs in Web API project
e.g. Console.WriteLine in Console project
From the aforementioned Debug Panel, run the Web API project and then the Console project by clicking the Play/Debug button for each launch configuration.
Note: when the web browser launches at the root of the website, you may browse to the WeatherForecast Controller manually, e.g. https://localhost:5001/WeatherForecast
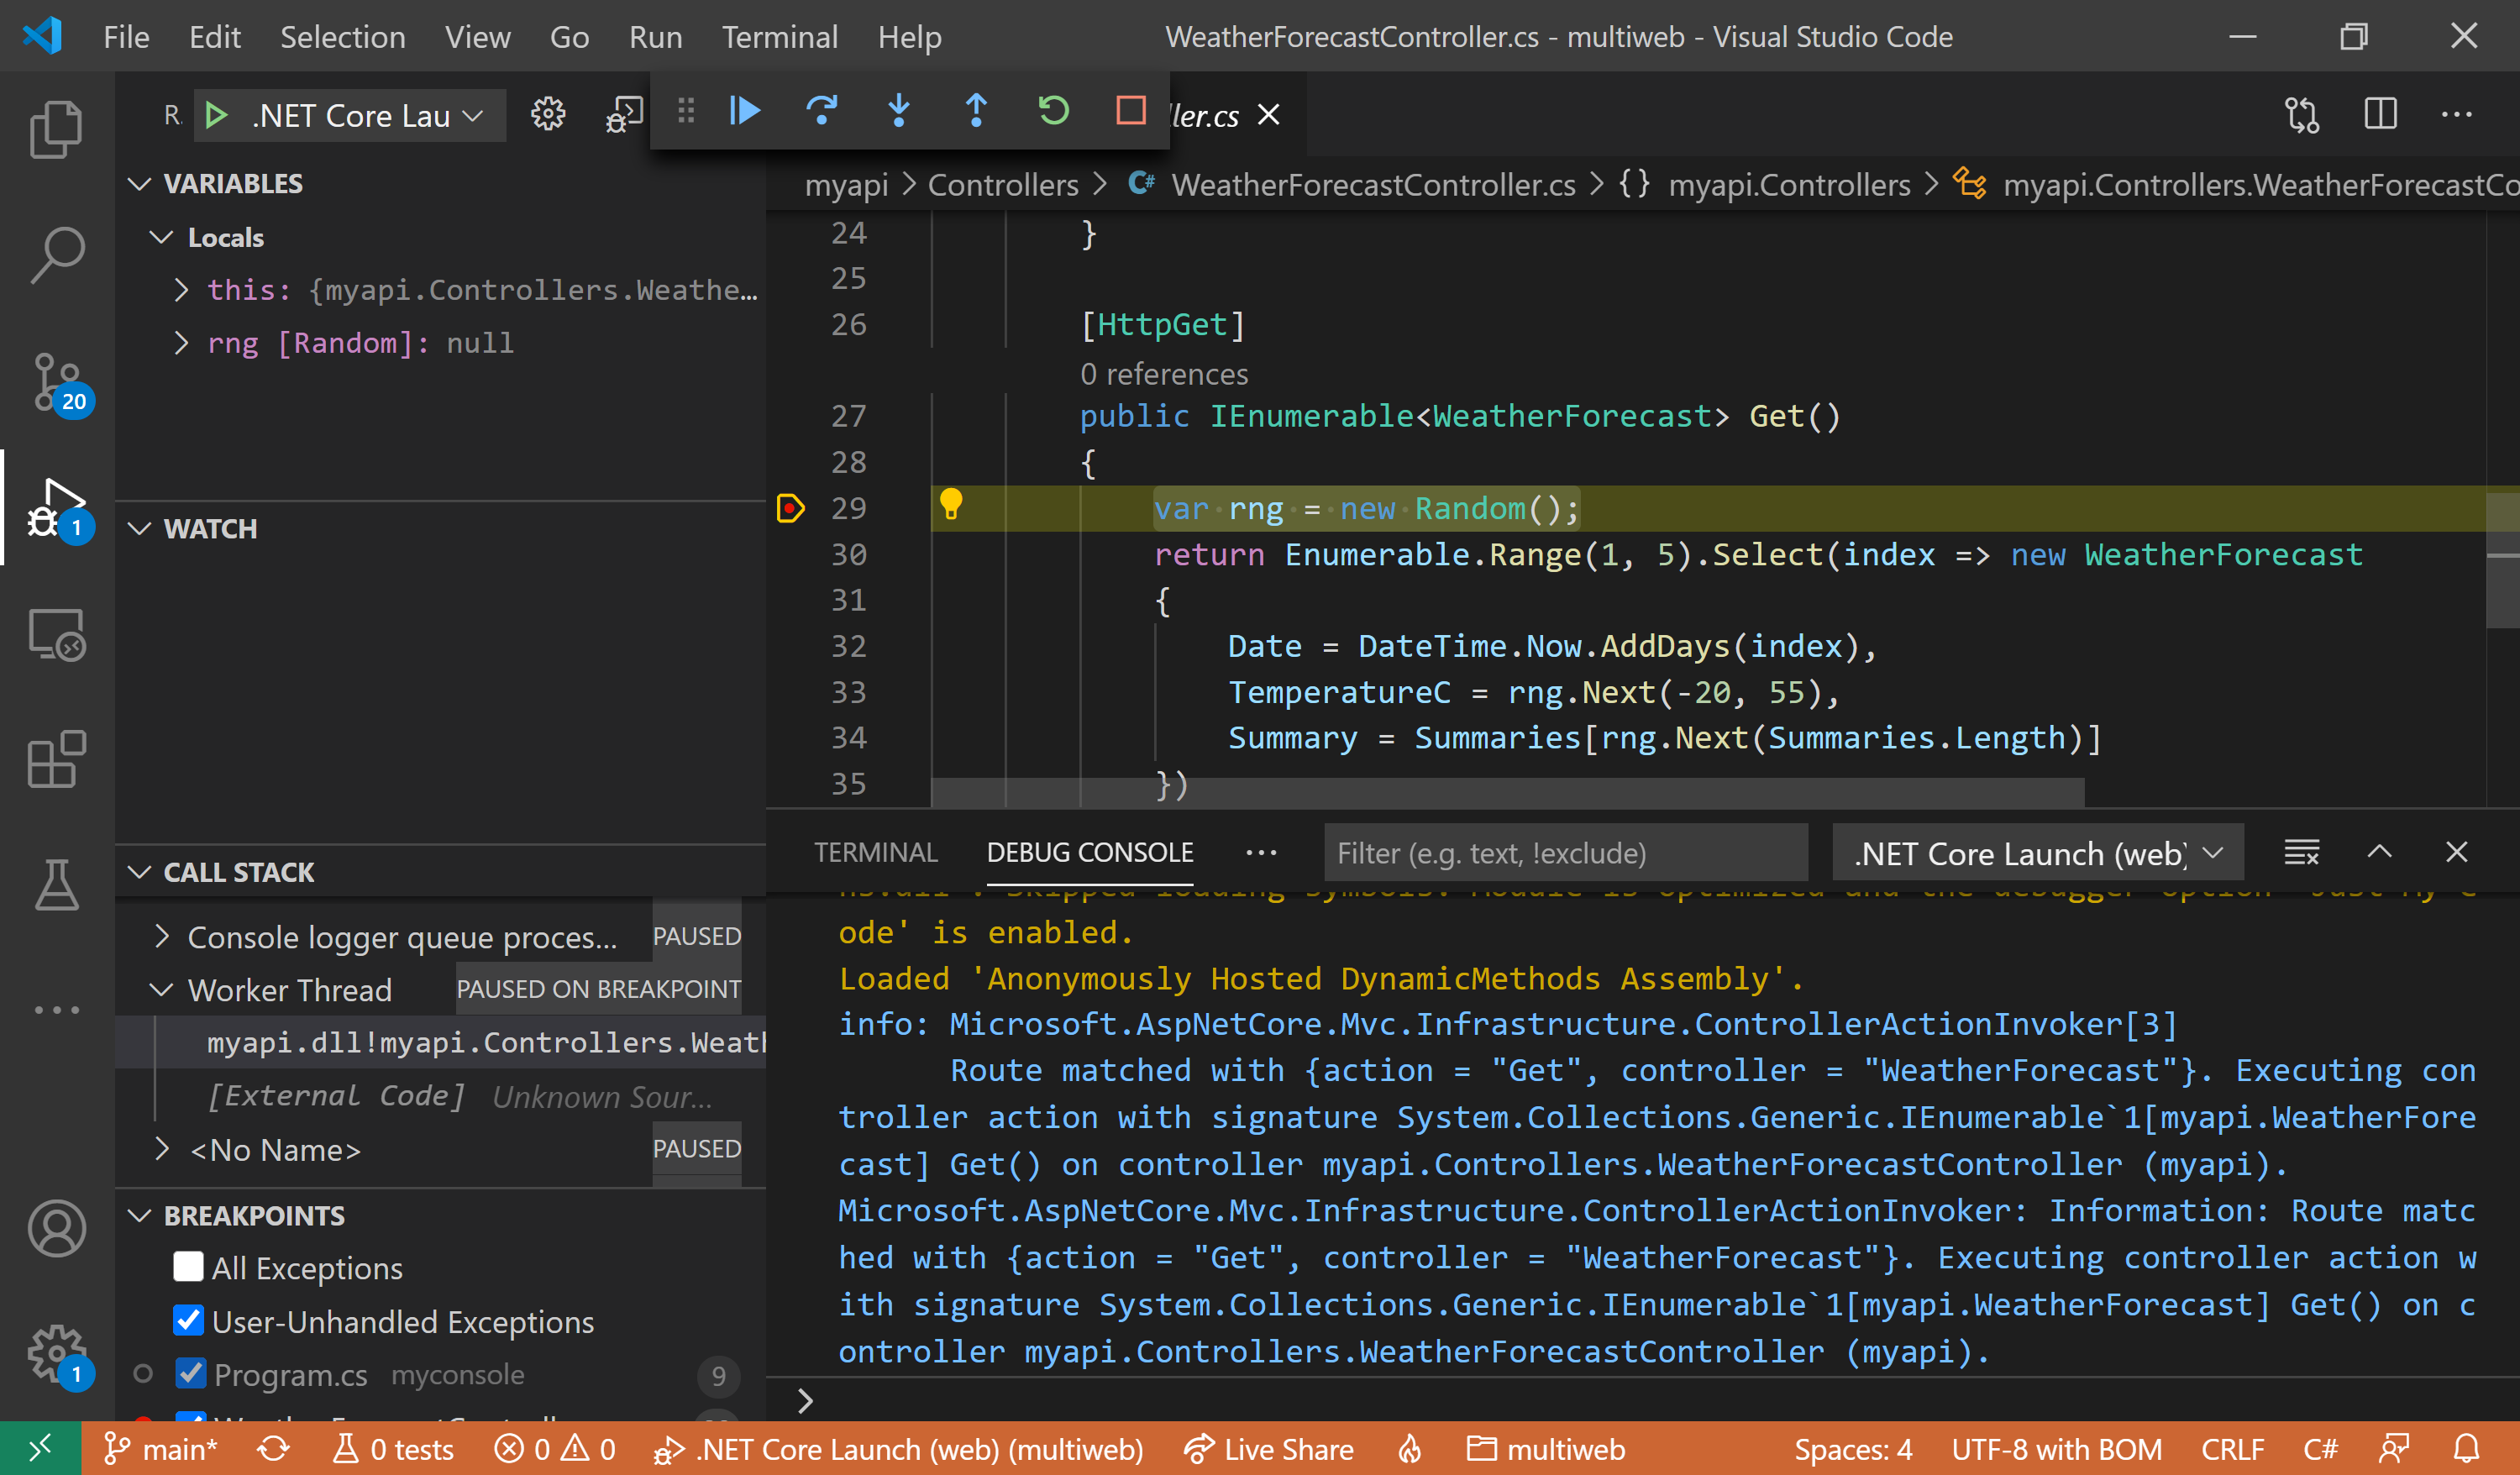
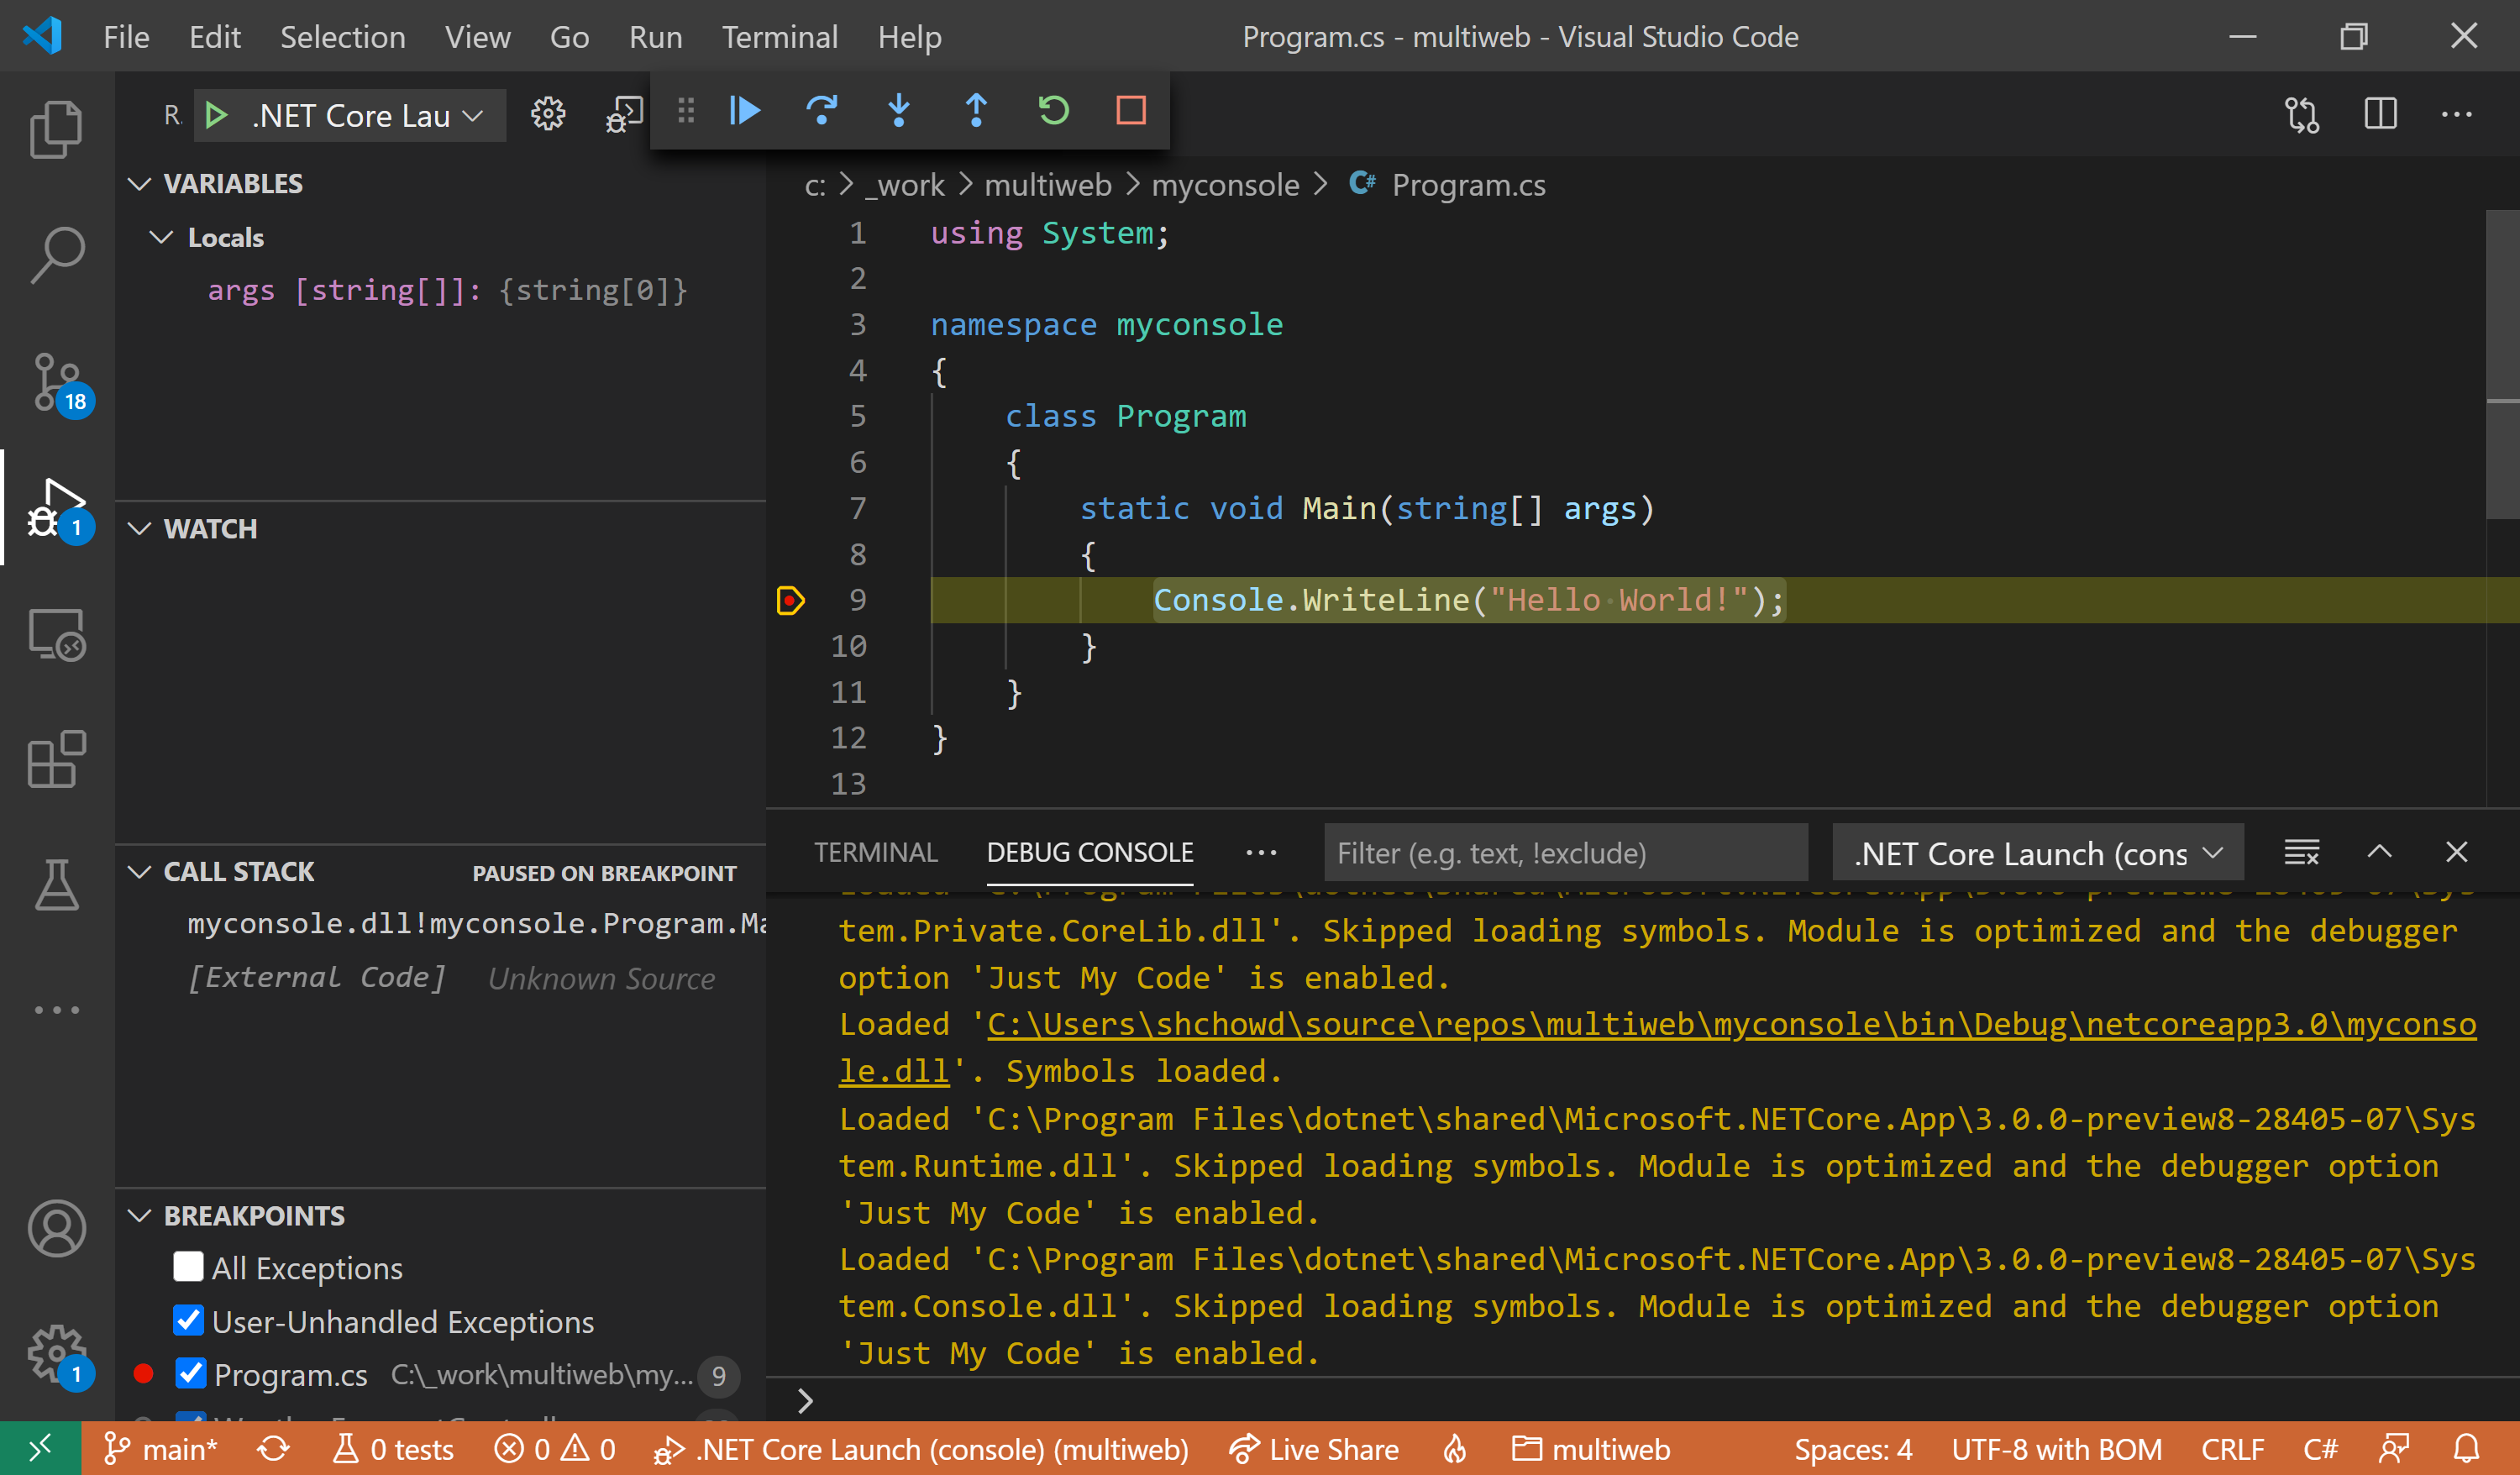
You should see each program pause at the breakpoints you set earlier.
e.g. Breakpoint in Web API project:
e.g. Breakpoint in Console project:
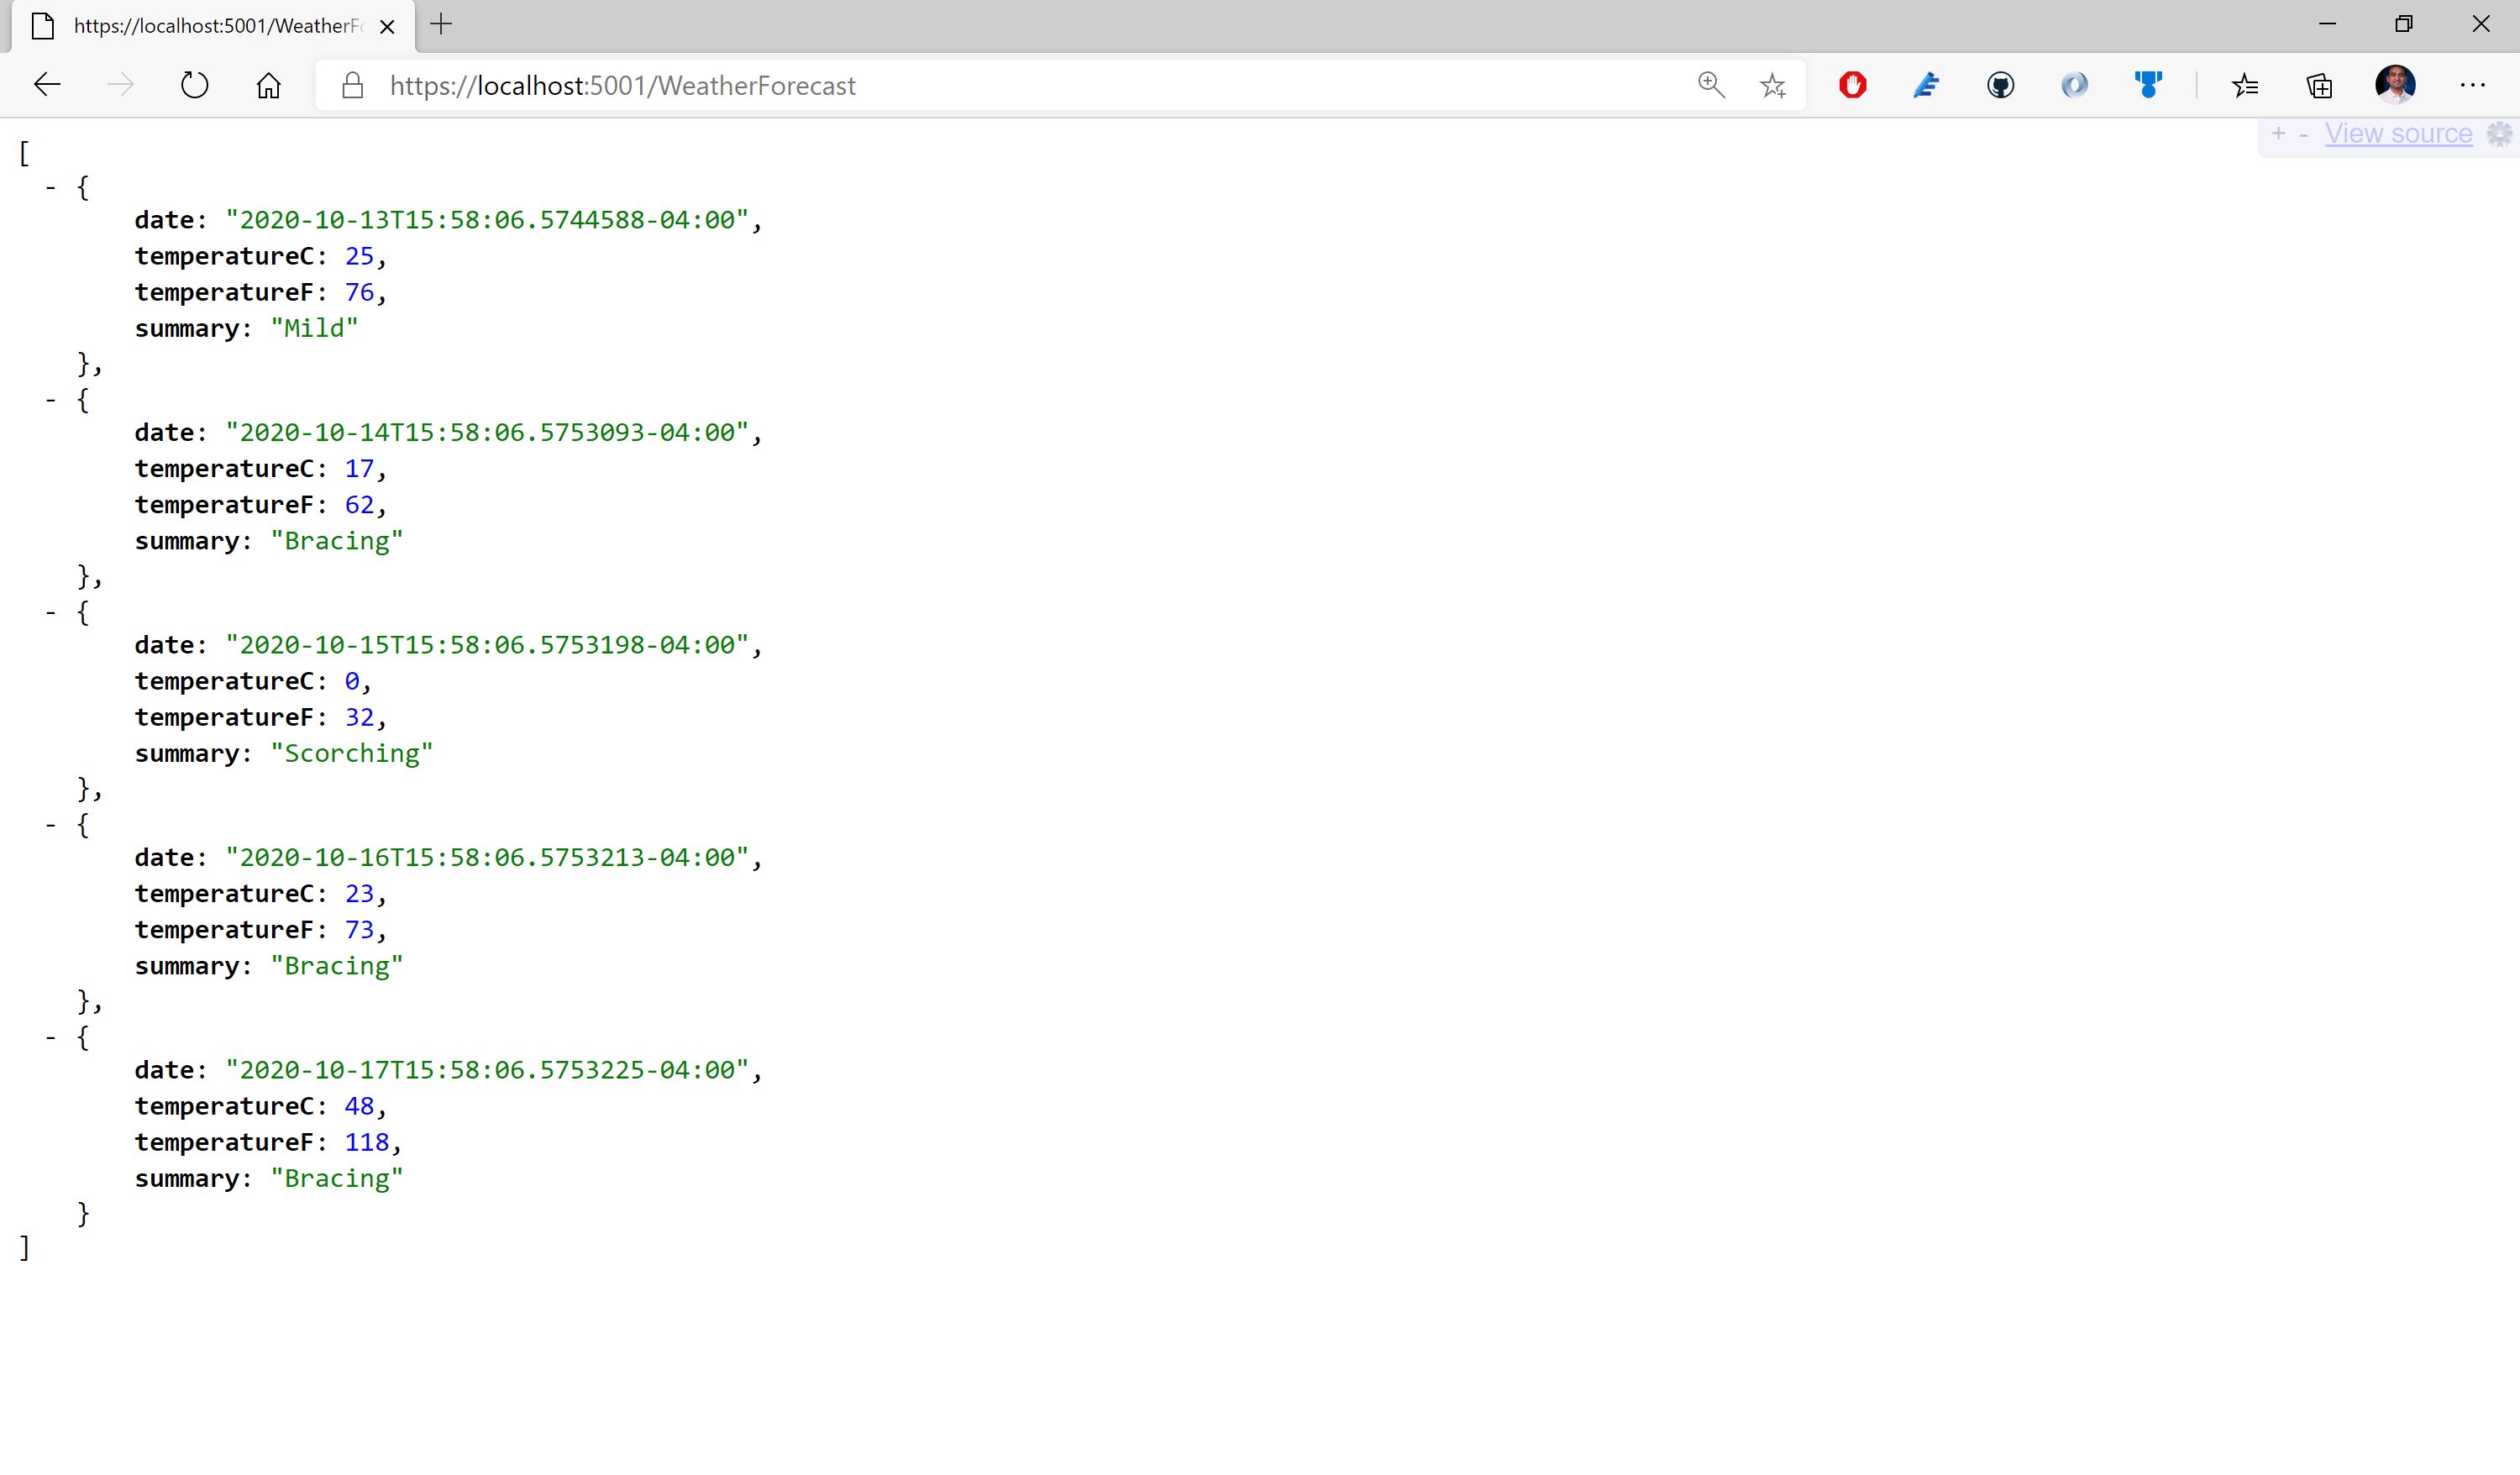
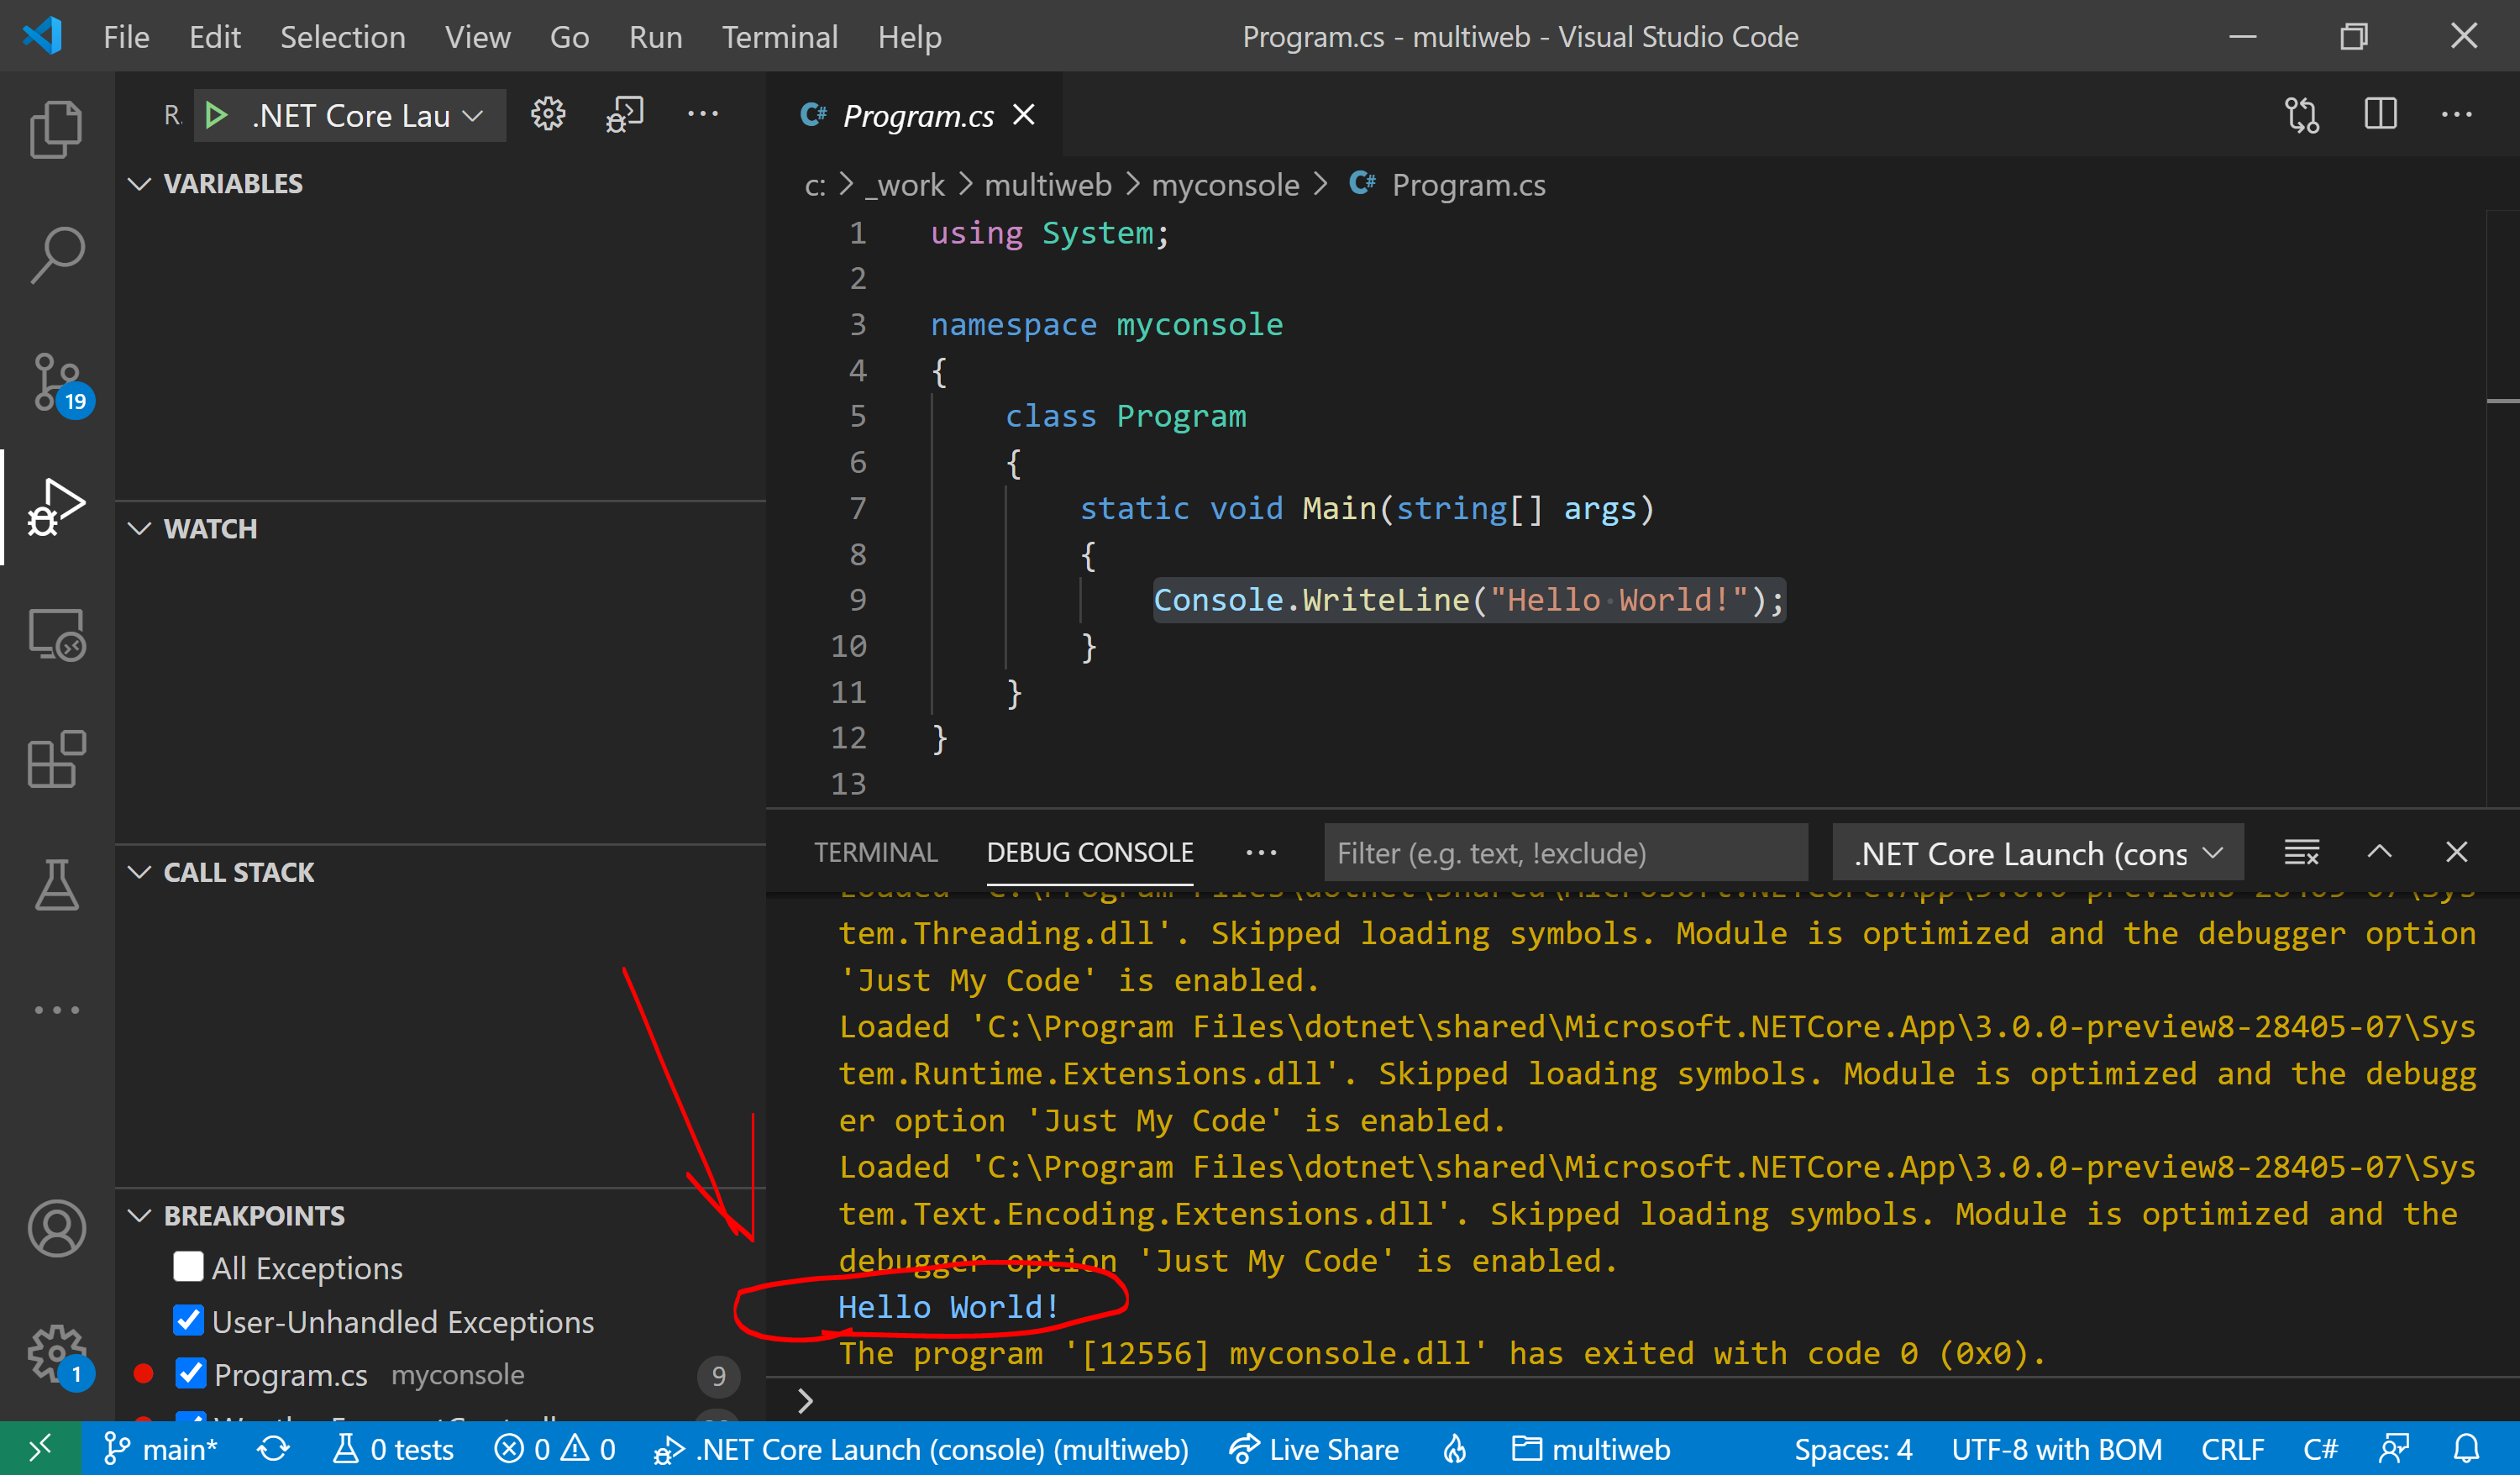
Press the Play/Continue button to continue running while debugging. Observe the output in a web browser (for the Web API project) or the Terminal within VS Code (for the Web API project)
e.g. Output in Web API project:
e.g. Output in Console project:
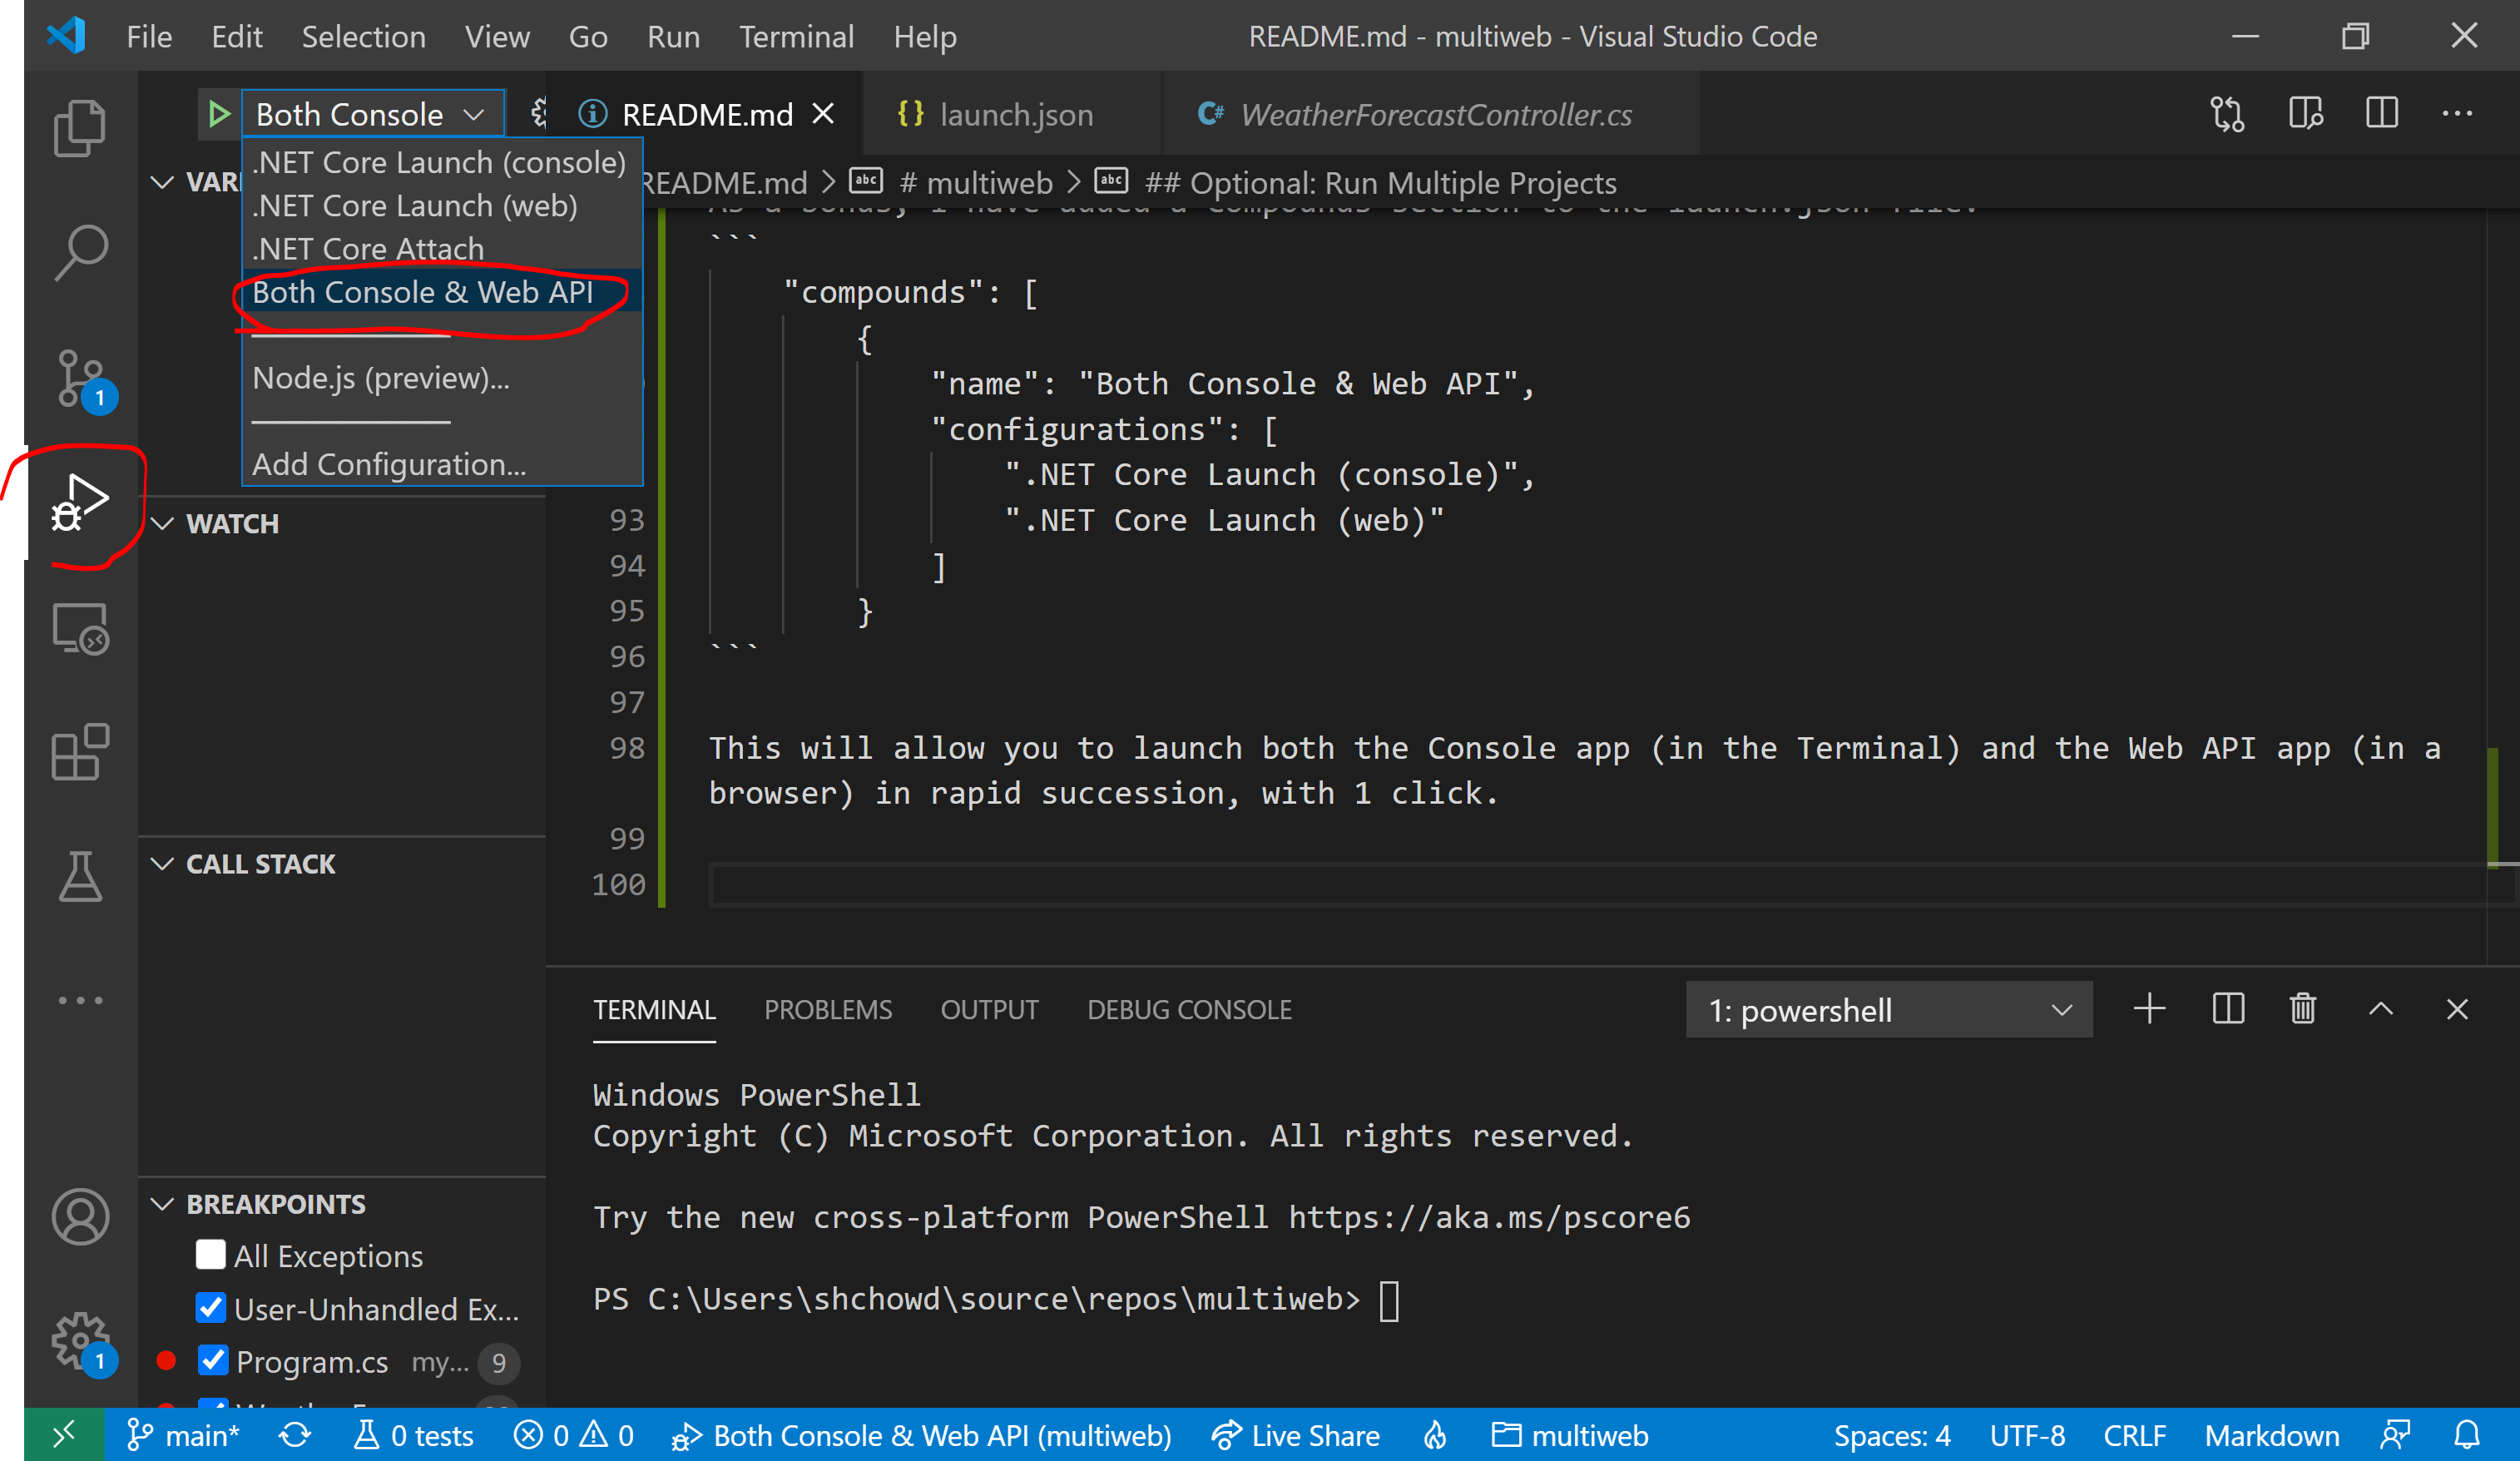
As a bonus, I have added a Compounds section to the launch.json file.
    "compounds": [
        {
            "name": "Both Console & Web API",
            "configurations": [
                ".NET Core Launch (console)",
                ".NET Core Launch (web)"
            ]
        }
This will allow you to launch both the Console app (in the Terminal) and the Web API app (in a browser) in rapid succession, with 1 click.
