

thetool is a CLI tool to capture different cpu, memory and other profiles for your node app in Chrome DevTools friendly format.
npx thetool -o . -t memorysampling npm run test
# .. open DevTools frontend and do three clicks to get:
thetool works only with Node >= 10.x.
thetool interface is simple as 1-2-3.
- Specify output folder using
-oflag, e.g.-o .to put output in current folder. - Specify tool using
-t, available tools: cpu, memorysampling, memoryallocation, coverage, type, heapsnapshot. - Specify any command to start node, e.g.
node index.jsornpx thetoolornpm run test.
When report is ready, thetool will dump thetool> Report captured in ... message in terminal with a hint how to analyze it.
- it can be used in environments where it is not possible to run Chrome DevTools, e.g., on the server, run
thetool <yourapp>there, send report back and analyze it locally, - it supports child processes and workers,
- it supports some other tools, e.g., node tracing and type profiler.
| Problem | Tool | Insight | DevTools tab |
|---|---|---|---|
| my app is slow | cpu | where in code does app spend most time? | Performance |
| my app requires too much memory | memorysampling | where in code does app allocate most memory? | Memory |
| my app requires too much memory | memoryallocation | most precise version of memorysampling with much bigger overhead | Memory |
| my app requires too much memory | heapsnapshot | what is inside the heap right now? | Memory |
| my app package is too big | coverage | what code was executed and how many times? | |
| my app needs type annotations | type | what are the types of function arguments and returns? |
You can use --ondemand flag to profile only part of your app:
- Add
--ondemandflag to the list of thetool arguments. - Call
startTheTool/stopTheToolfrom your Node scripts (thetool will add these methods to Node context).
startTheTool/stopTheTool methods are asynchronous, so you should await them or chain them using promise.then
Couple examples:
async function main() {
  await startTheTool();
  // code of your app
  await stopTheTool();
}
// .. or using promises..
function main() {
  startTheTool().then(() => {
    // code of your app
  }).then(() => stopTheTool());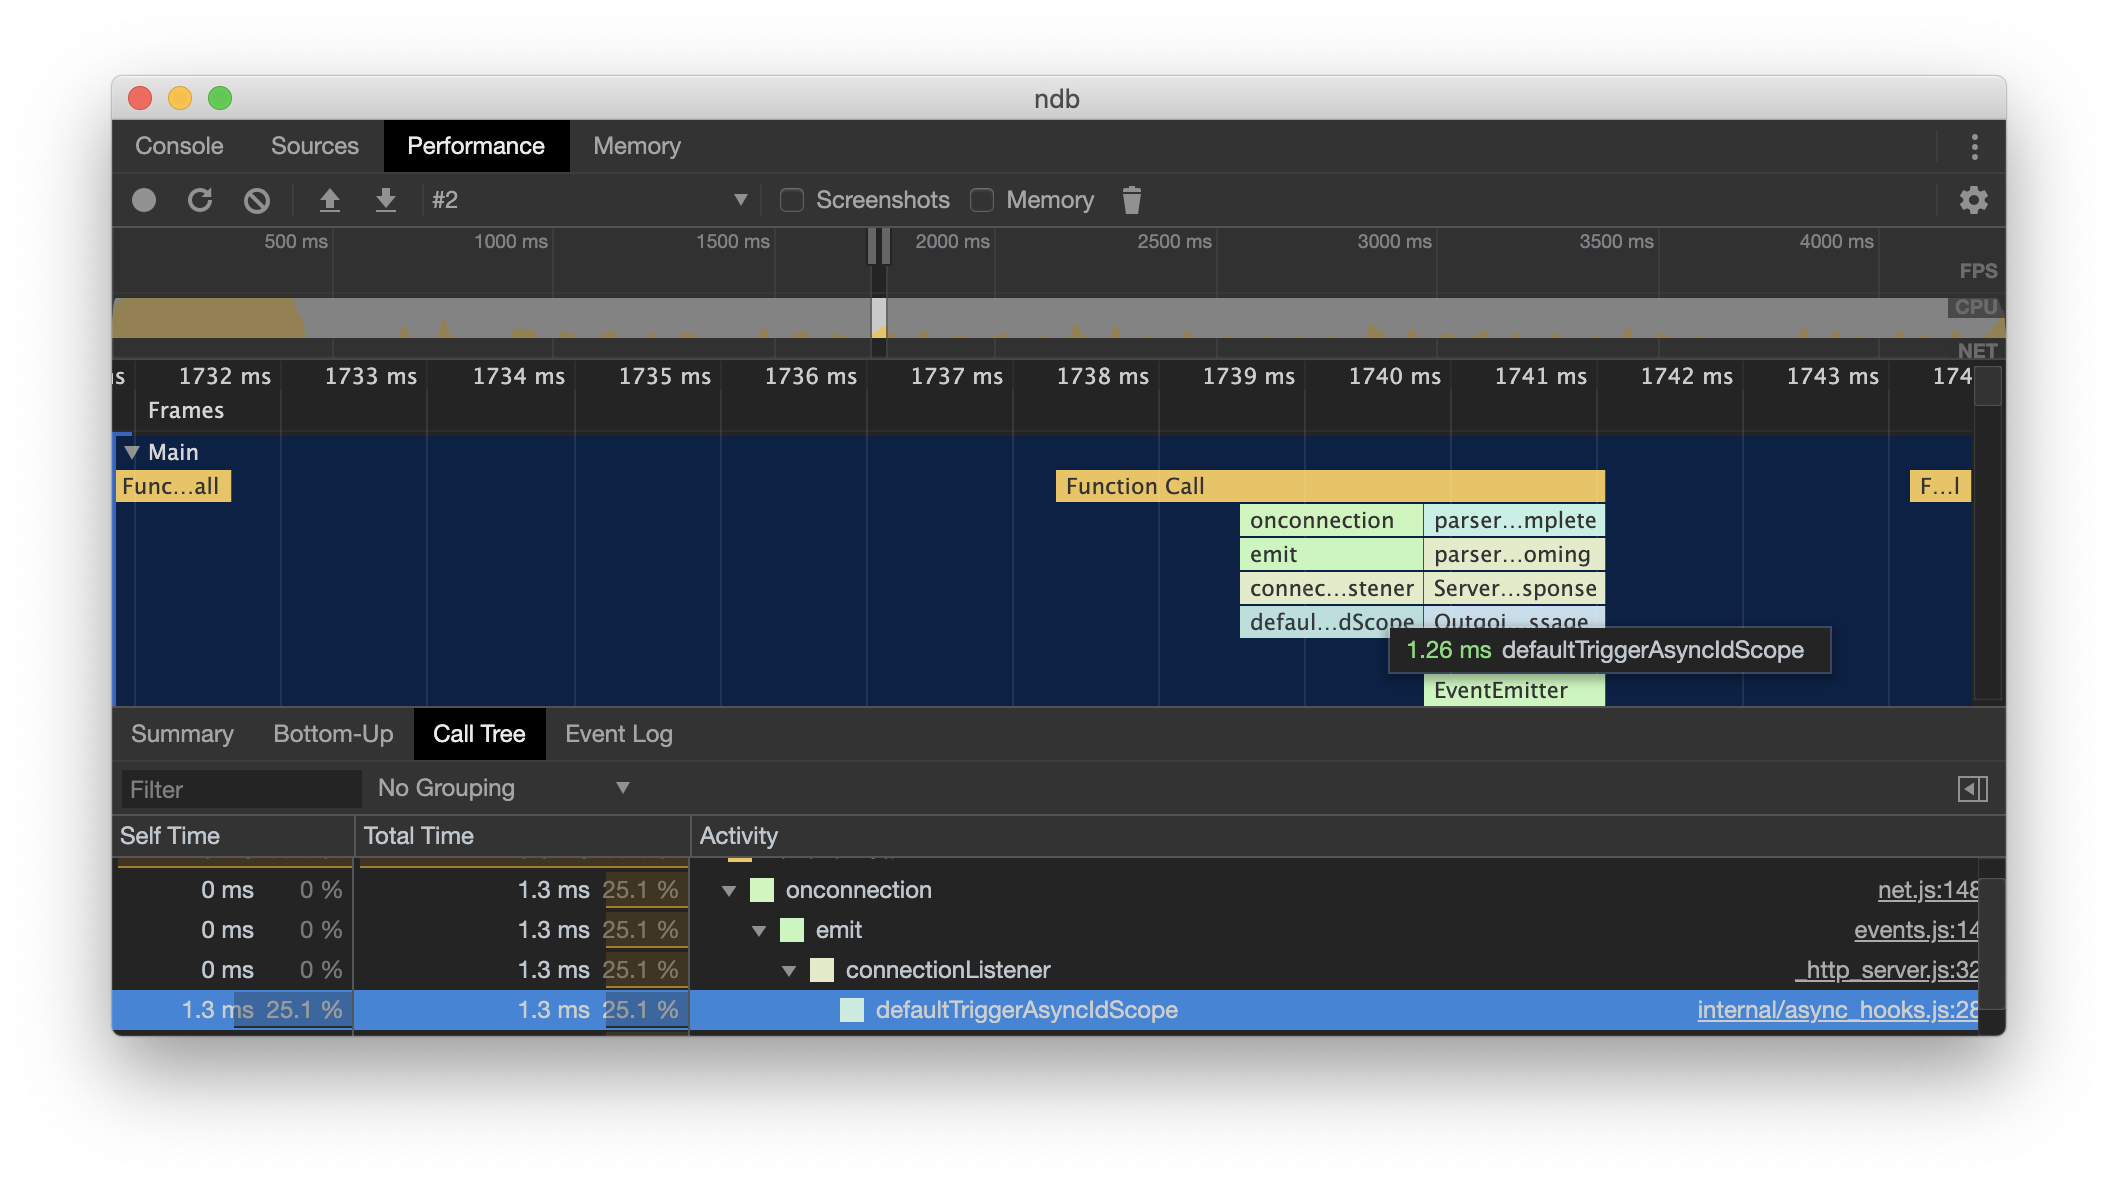
}thetool -o . -t cpu npm run testTo analyze: open Chrome DevTools, to to Performance tab, click load button, select file with data.
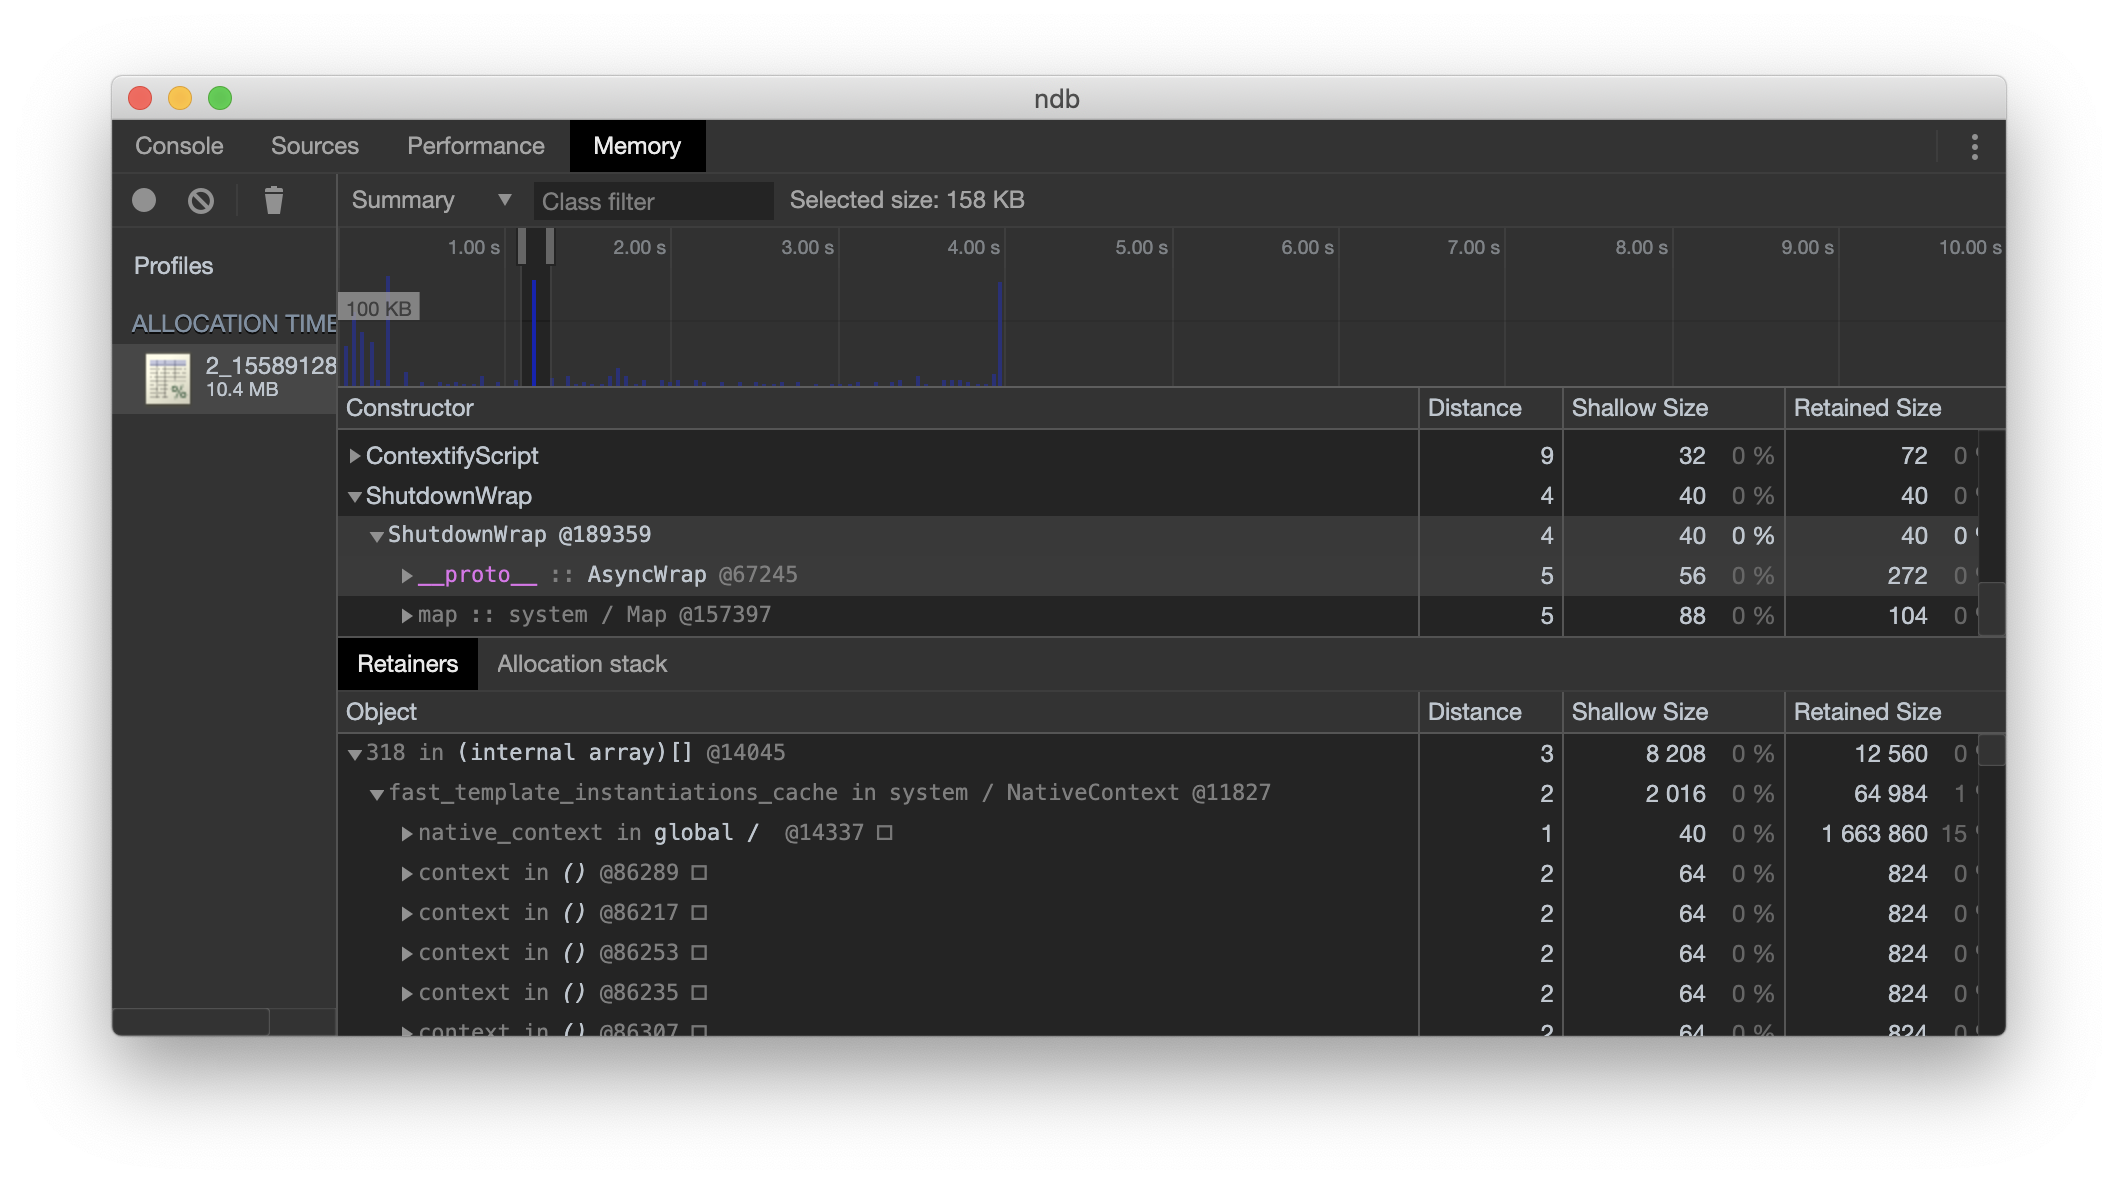
thetool -o . -t memorysampling npm run testTo analyze: open Chrome DevTools, go to Memory tab, click load button, select file with data.
--samplingInterval option is available: average sample interval in bytes, poisson distribution is used for the intervals. The default value is 32768 bytes
thetool -o . -t memoryallocation npm run testTo analyze: open Chrome DevTools, go to Memory tab, click load button, select file with data.
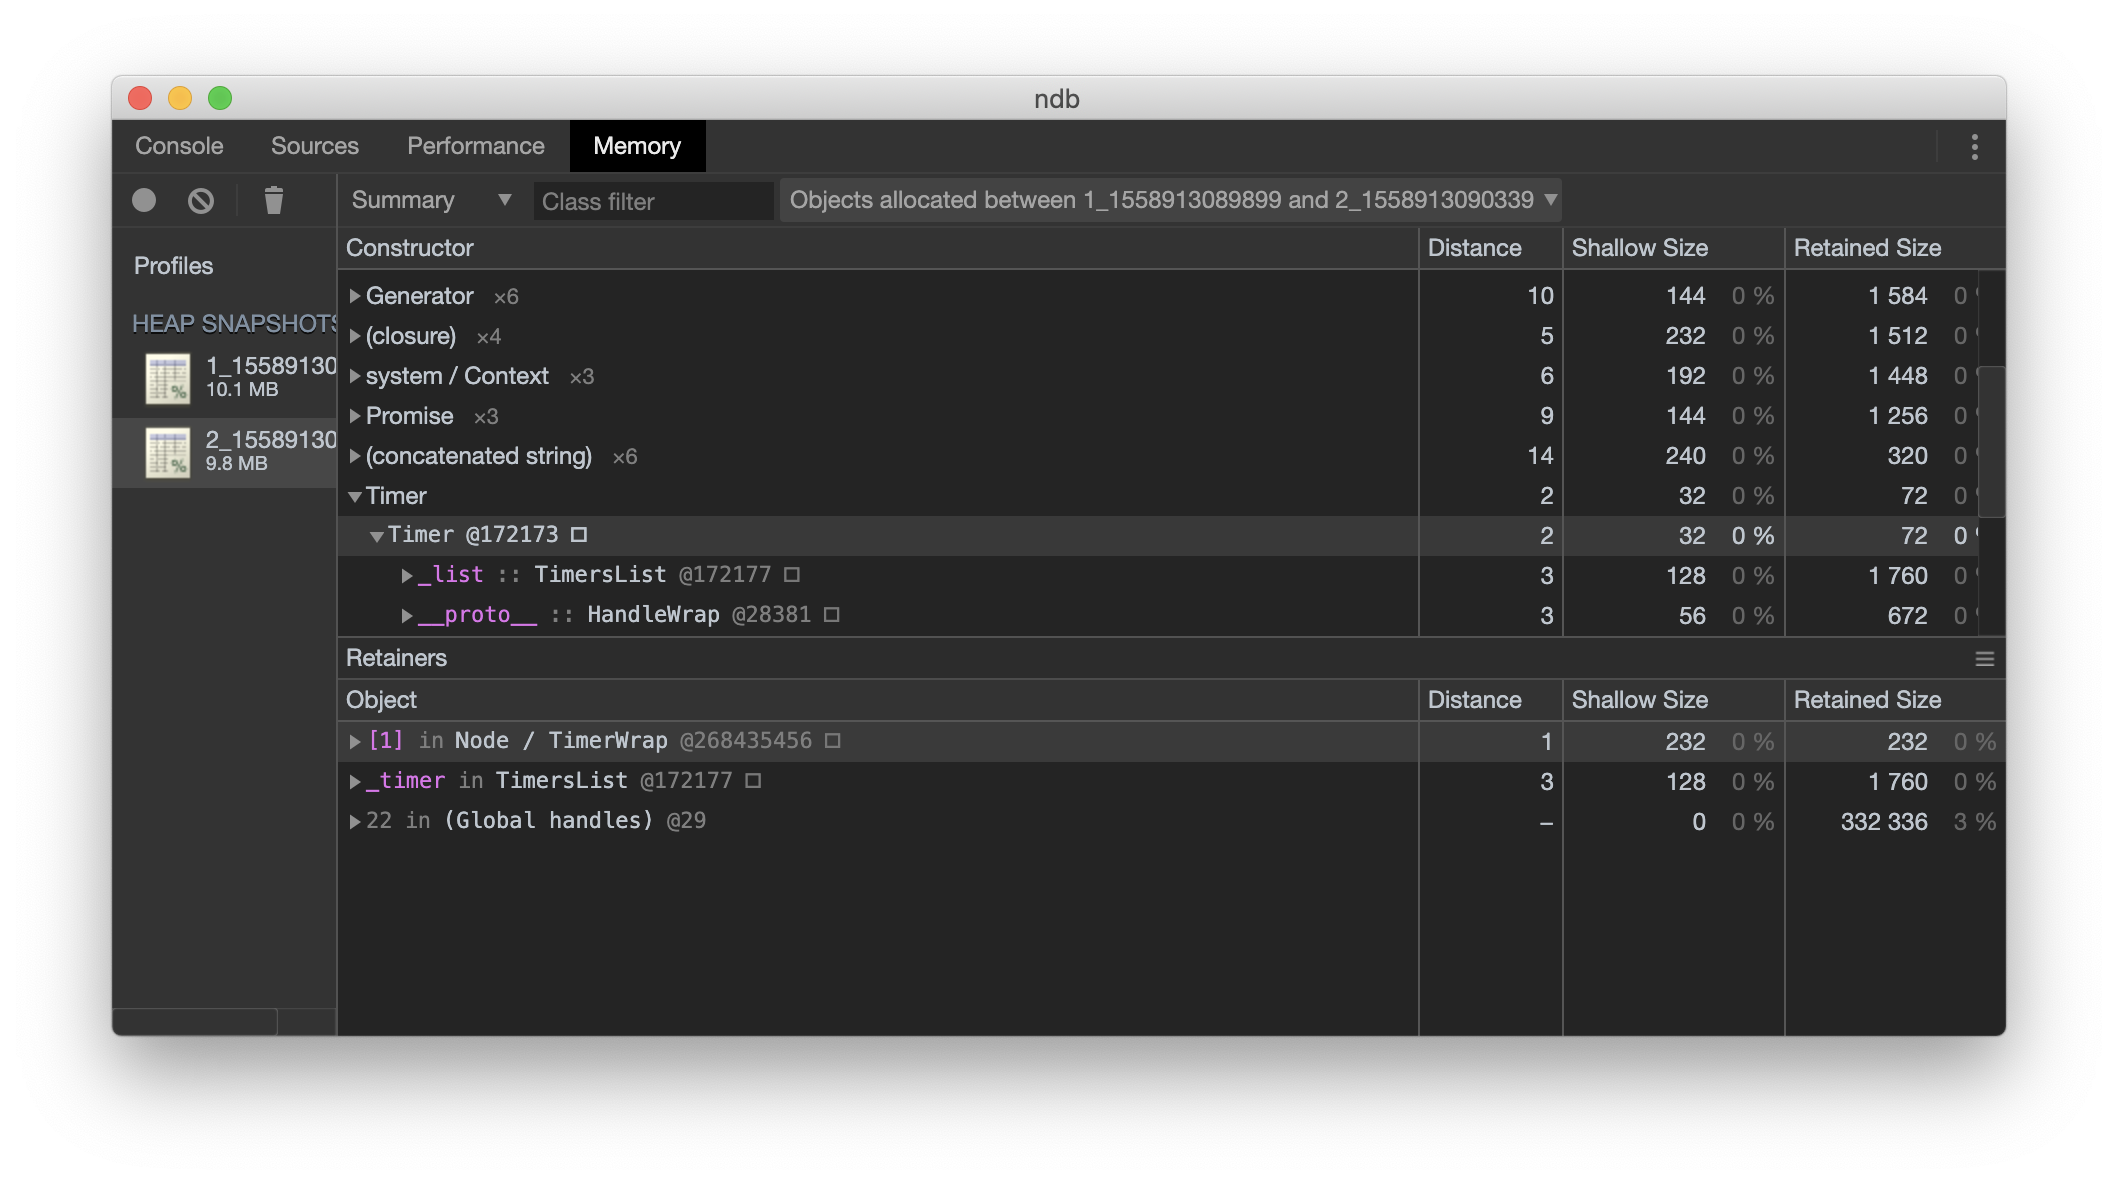
thetool -o . -t heapsnapshot node -e "captureTheTool.then(captureTheTool).then(captureTheTool)"Given command will capture three heap snapshots. To analyze: open Chrome DevTools, go to Memory tab, click load button, select file with data. You can load multiple snapshots and compare them from DevTools UI.
thetool -o . -t tracing --recordMode recordAsMuchAsPossible --includedCategories node,v8 npm run testTo analyze: open Chrome DevTools, go to Performance tab, click load button, select file with data.
--recordMode controls how the trace buffer stores data (recordUntilFull, recordContinuously, recordAsMuchAsPossible)
--includedCategories please take a look on different available categories on https://nodejs.org/api/tracing.html
E.g. you can capture V8 sampling profiler using following command:
thetool -o . -t tracing --recordMode recordAsMuchAsPossible --includedCategories v8.execute,v8.cpu_profiler,v8.cpu_profiler.hires npm run test
thetool -o . -t coverage npm run testTo analyze: in current folder create ./coverage/tmp folder and move files with data to this folder, run c8: npx c8 report. Please take a look at c8 README.md to see what output formats are supported.

thetool -o . -t type npm run testTo analyze: no tool yet.