Design and implementation of a trustworthy industrial log monitoring system based on Hyperledger Fabric Blockchain
The aim of the project is to design and implement a log monitoring system that guarantees the immutablity of the logs. To that end, the system will make use of the Hyerledger Fabric Blockchain, as well as many other services.
This repository includes detailed information about the design and implementation of the log monitoring system, as well as the sourcecode of the project and a useguide.
Note
🛠️ This repository is in developement stage at the moment. 🛠️
Developed and supported by sfl0r3nz05 and gomezander.
Contents
Versions
- Suricata: 6.0.6
- InfluxDB: 2.3.0
- Telegraf (StatsD): 1.23.2
- Postgres: 14.2.0
- Grafana: 8.4.3
Pre-requisites
- Download and install the latest available version of Docker
- Download and install the latest available version of Docker Compose
- Configure Docker as non root
Getting Started
Note
Suricata, Telegraf and InfluxDB have already been configured. If you dont't want to make changes to any of these services, you can skip directly to Setting up.
Configure suricata
-
Download rules from the community:
wget http://rules.emergingthreats.net/open/suricata/emerging.rules.tar.gz
-
Unzip the rules
tar zxvf emerging.rules.tar.gz
-
Move
~/rulesfolder to~/composer-suri-tele-infl-graf/suricata/sudo mv rules /var/lib/suricata/
-
Configure
docker-compose.yamlfile, adding next line as volume:- ./suricata/rules:/var/lib/suricata/rules
-
Create
my-rulesfile:- vim ~/composer-suri-tele-infl-graf/suricata/rules/my-rules -
Add next rules:
-
Ping detection
alert icmp any any -> $HOME_NET any (msg:"ICMP connection attempt"; sid:1000002; rev:1;)
-
SSH connections detection
alert tcp any any -> $HOME_NET 22 (msg:"SSH connection attempt"; sid:1000003; rev:1;)
-
Detects excessive packet forwarding to port 80.
alert tcp any any -> $HOME_NET 80 (msg:"DDoS Unusually fast port 80 SYN packets outbound, Potential DDoS"; flags: S,12; threshold: type both, track by_dst, count 500, seconds 5; classtype:misc-activity; sid:6;)
-
-
Edit suricata configuration file:
sudo vim ~/composer-suri-tele-infl-graf/suricata/suricata.yaml -
Modify
default-rule-pathaddingpath,community rulesandpersonal rules:default-rule-path: /var/lib/suricata/rules rule-files: - emerging-exploit.rules - my-rules
Configure suricata.yaml
Configure a unix stream as an output to enable communication with Telegraf.
# Configure the type of alert (and other) logging you would like.
outputs:
  # a line based alerts log similar to Snort's fast.log
  - fast:
      enabled: yes
      filename: fast.log
      append: yes
      filetype: regular # 'regular', 'unix_stream' or 'unix_dgram'

  - eve-log:
      enabled: yes
      filetype: unix_stream
      filename: /var/run/suricata/suricata-command.socket
      types:
        - stats:
            totals: yes       # stats for all threads merged together
            threads: yes       # per thread stats
            deltas: yes        # include delta values
        - alert:
           enabled: yes
           payload: yes
           metadata: yes
Global stats configuration
# Global stats configuration
stats:
  enabled: yes
  # The interval field (in seconds) controls the interval at
  # which stats are updated in the log.
  interval: 8
  # Add decode events to stats.
  decoder-events: true
  # Decoder event prefix in stats. Has been 'decoder' before, but that leads
  # to missing events in the eve.stats records. See issue #2225.
  decoder-events-prefix: "decoder.event"
  # Add stream events as stats.
  stream-events: false
Eve-log configuration
- eve-log:
    enabled: yes
    filetype: unix_stream
    filename: /var/run/suricata/suricata-command.socket
    types:
      - stats:
          totals: yes       # stats for all threads merged together
          threads: yes       # per thread stats
          deltas: yes        # include delta values
      - alert:
         enabled: yes
         payload: yes
         metadata: yes
Configure telegraf
configure telegraf.conf
Global tags configuration
# Global tags can be specified here in key="value" format.
[global_tags]
  # dc = "us-east-1" # will tag all metrics with dc=us-east-1
  # rack = "1a"
  ## Environment variables can be used as tags, and throughout the config file
  # user = "$USER"
Input configuration
# Suricata stats and alerts plugin
[[inputs.suricata]]
  ## Data sink for Suricata stats and alerts logs
  # This is expected to be a filename of a
  # unix socket to be created for listening.
  source = "/var/run/suricata-command.socket"

  # Delimiter for flattening field keys, e.g. subitem "alert" of "detect"
  # becomes "detect_alert" when delimiter is "_".
  delimiter = "_"

  ## Detect alert logs
  alerts = true
Output configuration
# # Configuration for sending metrics to InfluxDB
[[outputs.influxdb_v2]]
  ## The URLs of the InfluxDB cluster nodes.
  ##
  ## Multiple URLs can be specified for a single cluster, only ONE of the
  ## urls will be written to each interval.
  ##   ex: urls = ["https://us-west-2-1.aws.cloud2.influxdata.com"]
  urls = ["http://influxdb:8086"]

  ## Token for authentication.
  token = "$INFLUXDB_INIT_ADMIN_TOKEN"

  ## Organization is the name of the organization you wish to write to; must exist.
  organization = "$INFLUXDB_INIT_ORG"

  ## Destination bucket to write into.
  bucket = "$INFLUXDB_INIT_BUCKET"
Environmental variables must be updated on: ~/composer-suri-tele-infl-graf
INFLUXDB_INIT_ORG=myorganization
INFLUXDB_INIT_BUCKET=mybucket
INFLUXDB_INIT_ADMIN_TOKEN=vF2hjj43zMjHTWTkoLeocGrq9VRBZLN-540x5eyVoZ0NlZGJZ5op_VLgWrbkENFICiXk87rwB1T7wB8a93VonQ==
Setting Up
Permissions for Socket shared in volume
-
Give permissions to the shared volume for sockets
sudo chmod 777 /var/run/shared
-
Add aditional volume in suricata docker-compose service:
- /var/run/shared:/var/run/suricata/
-
Add aditional volume in telegraf docker-compose service:
- /var/run/shared:/var/run/
Configure InfluxDB
# Login credentials can be edited in /influxdb/influxdb.env
user: admin
password: admin123456-
Verify the bucket creation
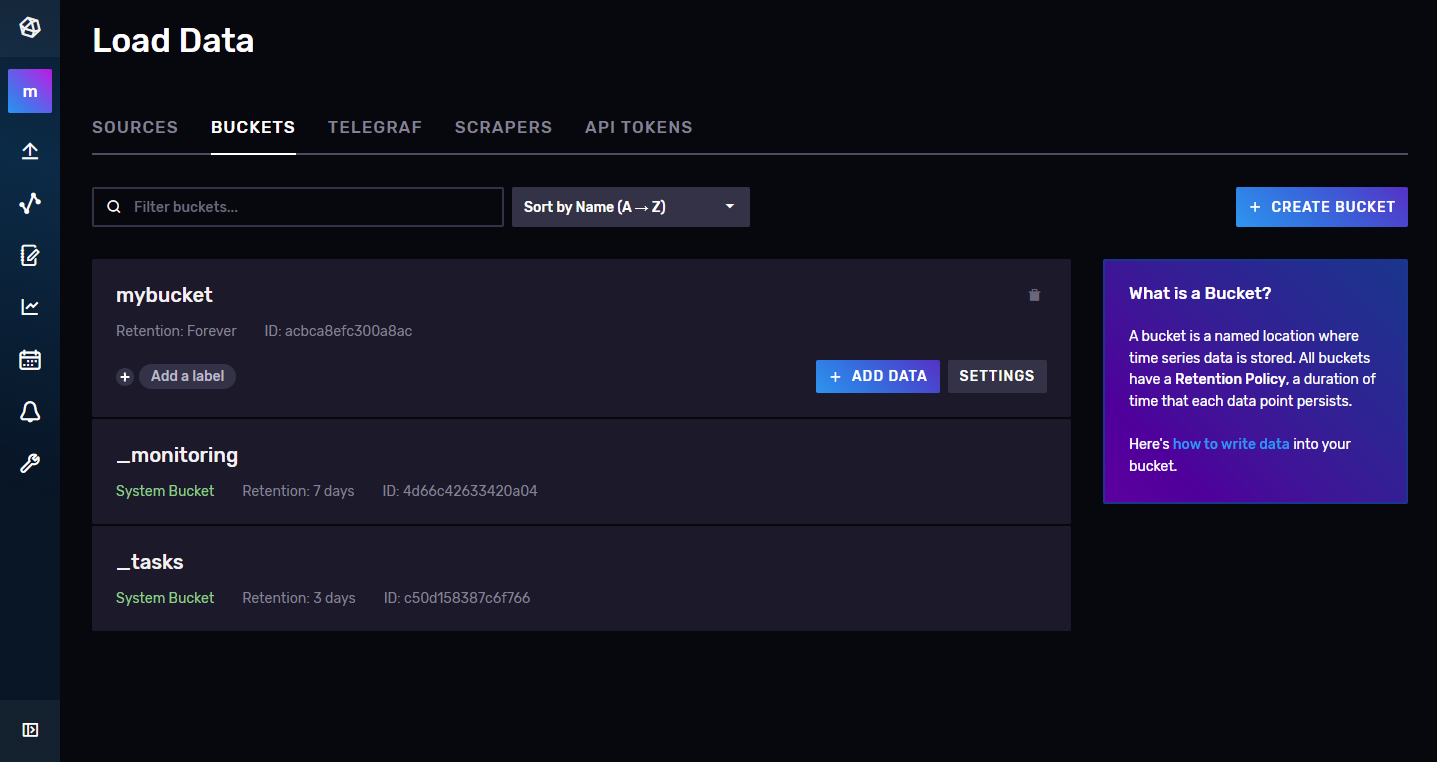
-
Associate telegraf agent to this bucket
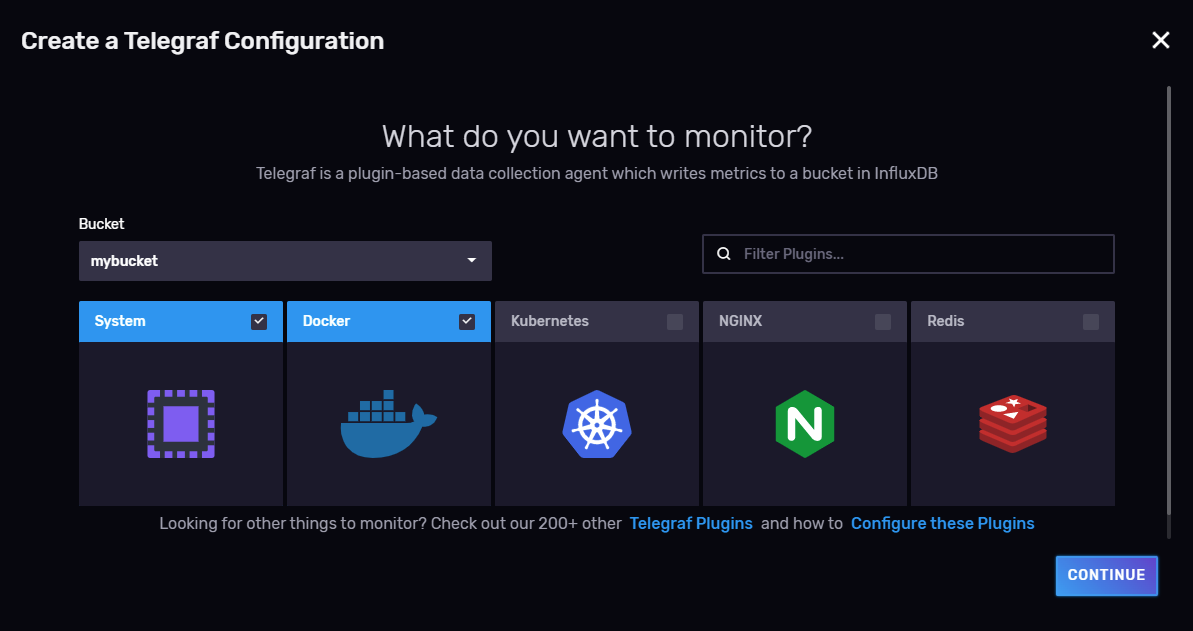
-
Configure plugins
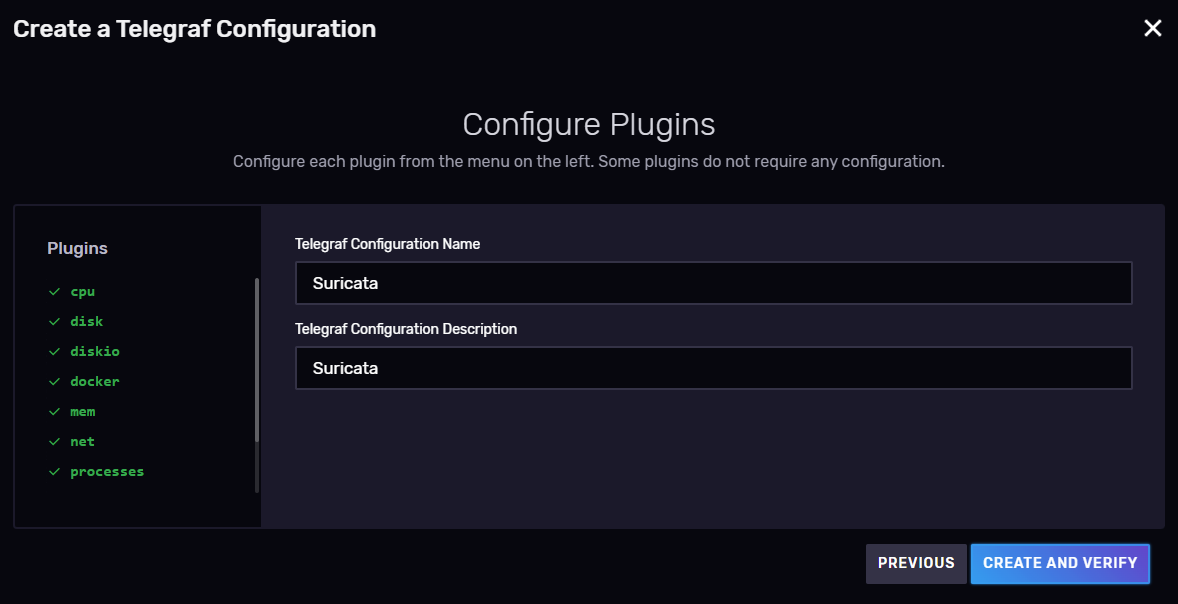
-
Collect token and press Listen for Data Button
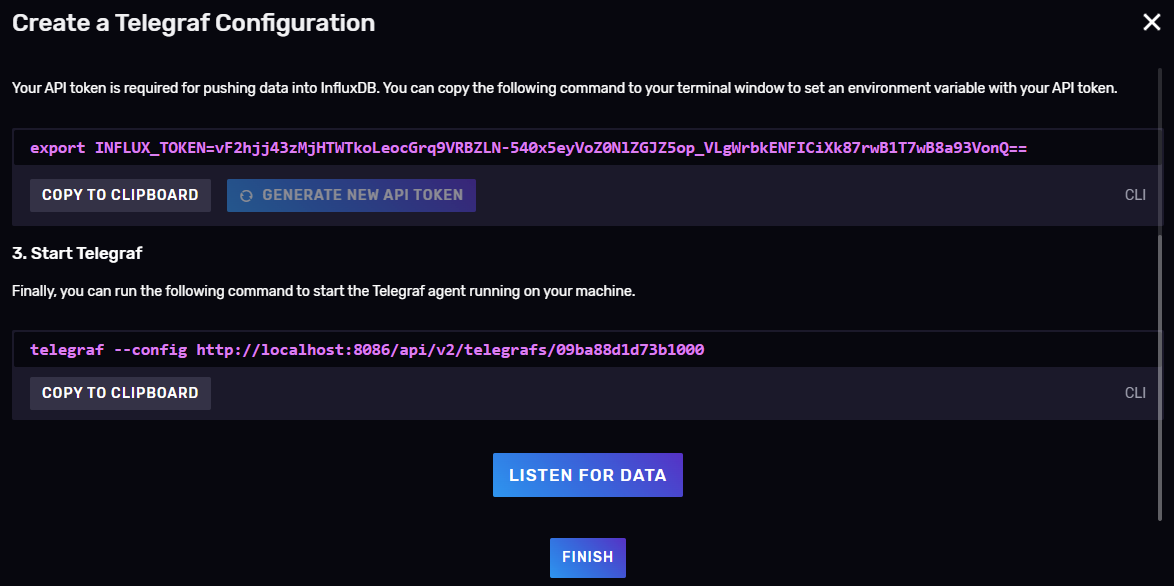
-
Select metrics and configure dashboard


How to Start
In order to start the service the first time launch:
-
Start influxdb:
COMPOSE_PROFILES=influx docker compose up -d
-
Configure influxDB as section Configure InfluxDB
-
Start telegraf:
COMPOSE_PROFILES=telegraf docker compose up -d
You can replace
COMPOSE_PROFILES=grafana,telegrafwith the desired profiles to launch, you can launch only InfluxDB (default with no profiles).To stop the service launch:
COMPOSE_PROFILES=grafana,telegraf docker compose down
Make sure that telegraf creates the socket to communicate with suricata correctly, by checking the logs os the container.
docker compose logs
It is important that the telegraf container is started before the suricata container, otherwise suricata won't be able to connect to the socket.
-
Start suricata
COMPOSE_PROFILES=suricata docker compose up -d
Once again make sure that suricata connects to the socket properly.
docker compose logs
-
Configure InfluxDB datasource from web interface
InfluxDB data source is automatically provisioned with new Flux language support flag.
Username: admin
Password: admin123456
Port: 8086
Once configured the telegraf agent as section Configure InfluxDB copy the token and paste it in telegraf.env inside the telegraf folder.
Start telegraf container and restart suricata container.
COMPOSE_PROFILES=telegraf,suricata docker compose up -d
-
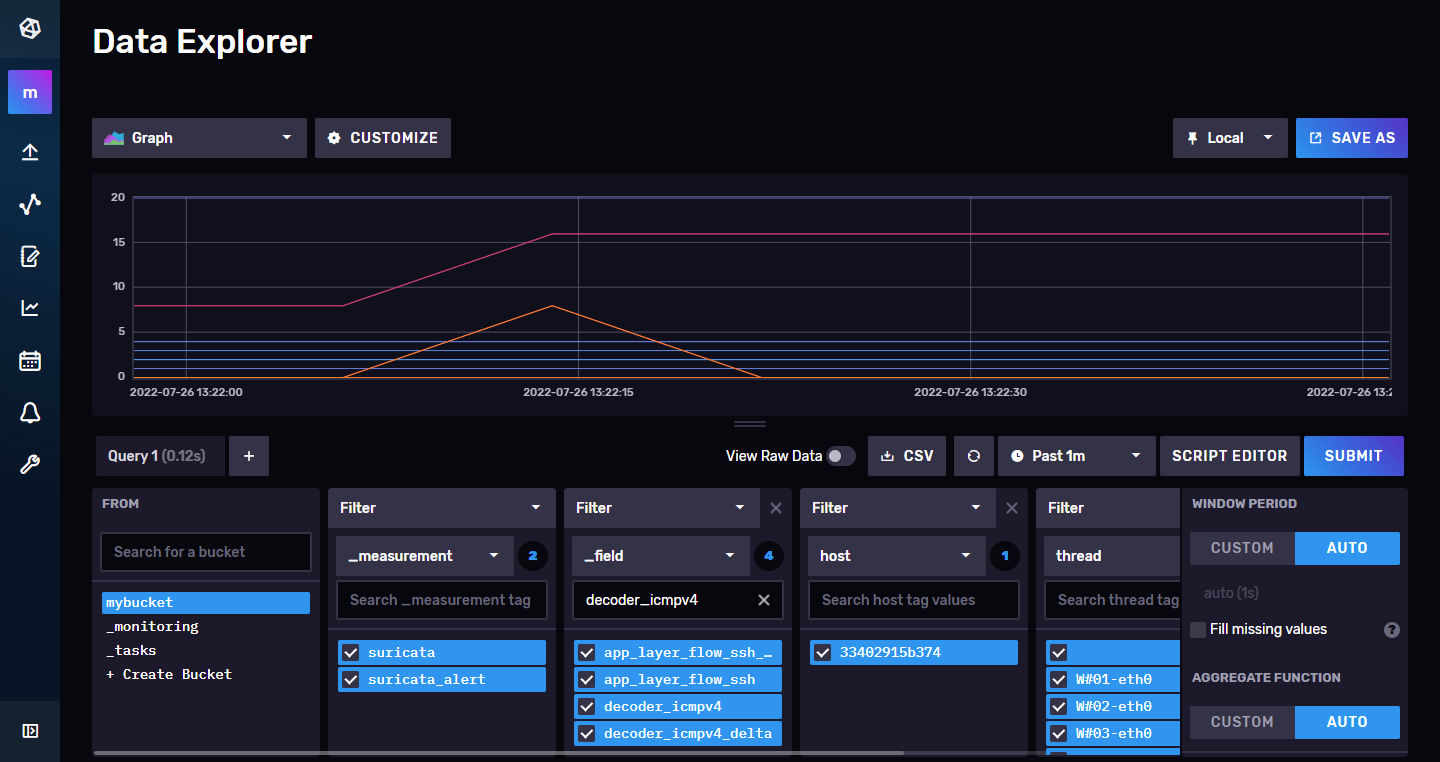
Check that suricata data is received in InfluxDB
Make a new dashboard and select the suricata alerts you want to see.

-
Start Grafana
COMPOSE_PROFILES=grafana docker compose up -d
Username: admin
Password: admin
Data source on Grafana
Check that InfluxDB datasource is added in Configuration --> Data Sources
Add a new panel and check that data is being received. You can use the examples provided by Grafana.

Create a neew dashboard and select the data you want to see by making a Flux query. You can copy the query from InfluxDB dashboard, selecting Script Editor.
In this case, we wanted to see the ssh alerts of suricata.


Final result in Grafana

Mapped Ports
Host		Container		Service

3000		3000			grafana
8086		8086		  	influxdb
8125		8125			statsd
Troubleshootings
Test socket on suricata container
- Use the tool:
root@dd39f97b4f3f:/suricata/python# suricatasc
Unable to connect to socket @e_localstatedir@/suricata-command.socket: [Errno 2] No such file or directory
root@dd39f97b4f3f:/suricata/python# suricatasc /var/run/suricata-command.socket
Command list: shutdown, command-list, help, version, uptime, running-mode, capture-mode, conf-get, dump-counters, reload-rules, ruleset-reload-rules, ruleset-reload-nonblocking, ruleset-reload-time, ruleset-stats, ruleset-failed-rules, register-tenant-handler, unregister-tenant-handler, register-tenant, reload-tenant, unregister-tenant, add-hostbit, remove-hostbit, list-hostbit, reopen-log-files, memcap-set, memcap-show, memcap-list, dataset-add, dataset-remove, iface-stat, iface-list, iface-bypassed-stat, ebpf-bypassed-stat, quit
>>> iface-list
Success:
{
    "count": 1,
    "ifaces": [
        "eth0"
    ]
}
>>> iface-stat eth0
Success:
{
    "bypassed": 0,
    "drop": 11284,
    "invalid-checksums": 2,
    "pkts": 183099
}
Test socket on telegraf container
- Update pakage manager:
apt update - Install git:
apt install git - Clone suricata repo:
git clone https://github.com/OISF/suricata.git - Access to directory:
cd /suricata/python/suricata/config/ - Rename file:
mv defaults.py.in defaults.py - Install python:
apt install -y build-essential libssl-dev libffi-dev python3-dev - Access to directory:
cd /suricata/python - Install tool
python3 setup.py install - Use the tool:
root@dd39f97b4f3f:/suricata/python# suricatasc
Unable to connect to socket @e_localstatedir@/suricata-command.socket: [Errno 2] No such file or directory
root@dd39f97b4f3f:/suricata/python# suricatasc /var/run/suricata-command.socket
Command list: shutdown, command-list, help, version, uptime, running-mode, capture-mode, conf-get, dump-counters, reload-rules, ruleset-reload-rules, ruleset-reload-nonblocking, ruleset-reload-time, ruleset-stats, ruleset-failed-rules, register-tenant-handler, unregister-tenant-handler, register-tenant, reload-tenant, unregister-tenant, add-hostbit, remove-hostbit, list-hostbit, reopen-log-files, memcap-set, memcap-show, memcap-list, dataset-add, dataset-remove, iface-stat, iface-list, iface-bypassed-stat, ebpf-bypassed-stat, quit
>>> iface-list
Success:
{
    "count": 1,
    "ifaces": [
        "eth0"
    ]
}
>>> iface-stat eth0
Success:
{
    "bypassed": 0,
    "drop": 11284,
    "invalid-checksums": 2,
    "pkts": 183099
}