The KNX Prometheus Exporter is a small bridge to export values measured by KNX sensors to
Prometheus. It takes the values either from cyclic sent GroupValueWrite telegrams and can request
values itself using GroupValueRead telegrams.
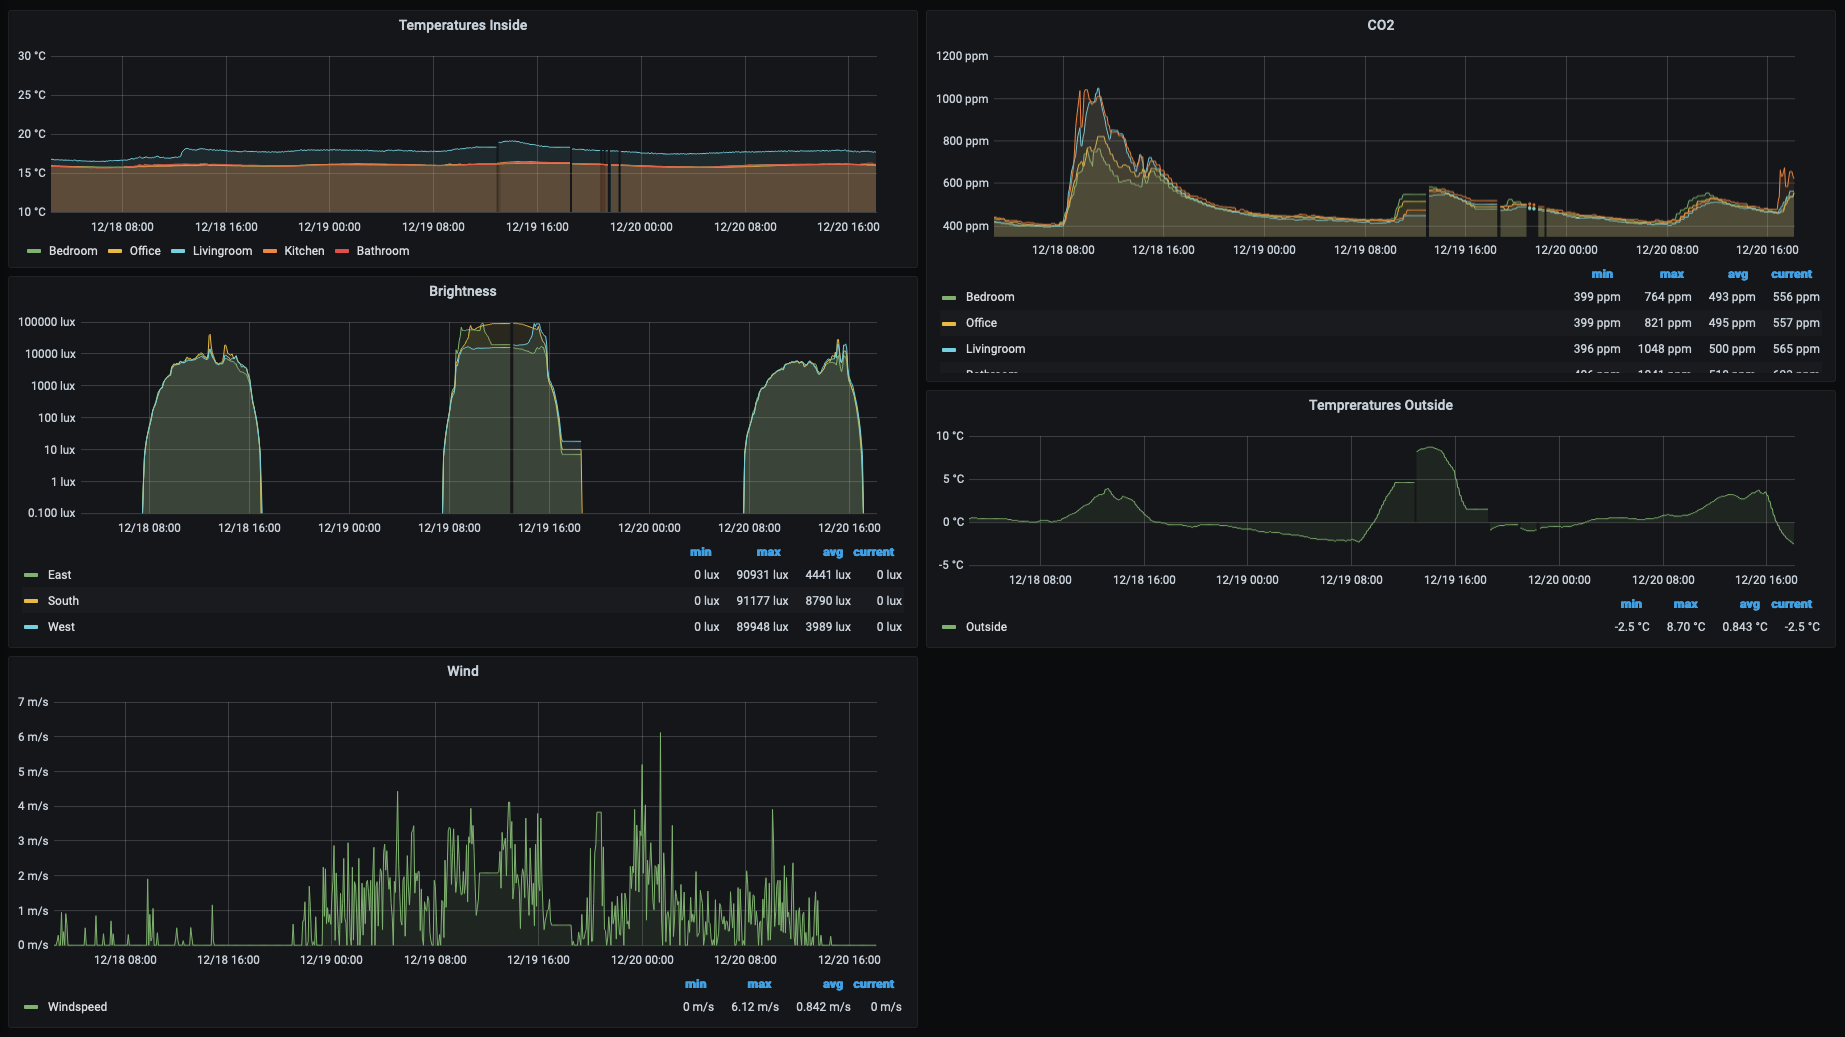
The data stored in prometheus can be visualized with Grafana. This could
look like the this screenshot:

- KNX Prometheus Exporter
Using brew tap:
brew tap chr-fritz/tap
brew install chr-fritz/tap/knx-exporterdocker pull quay.io/chrfritz/knx-exporterDownload the latest release and place
it in your $PATH.
The KNX Prometheus Exporter will only export the values from configured group addresses. A good starting point is to export the group addresses from ETS 5 into the XML format and convert them.
Please refer the KNX Documentation "Group Address & Export" for more information about how to export the group addresses to XML.
With the exported group addresses you can call the knx-exporter and convert them:
knx-exporter convertGA [SOURCE] [TARGET]You must replace [SOURCE] with the path to your group address export file. [TARGET] is the path
where the converted configuration should be stored.
Converting the group addresses is a good starting point for preparing the actual configuration. The simplest fully configuration will look like this:
Connection:
    Type: "Tunnel"
    Endpoint: "192.168.1.15:3671"
    PhysicalAddress: 2.0.1
MetricsPrefix: knx_
AddressConfigs:
    0/0/1:
        Name: dummy_metric
        DPT: 1.*
        Export: true
        MetricType: "counter"
        ReadActive: true
        MaxAge: 10m
        Comment: dummy comment
        Labels:
            room: office
In the next sections we will describe the meanings for every statement.
The Connection section contains all settings about how to connect to your KNX system and how the
KNX Prometheus Exporter will identify itself within it. It has three properties:
TypeThis defines the connection type to your KNX system. It can be eitherRouterorTunnel.EndpointThis defines the ip address or hostname including the port to where the KNX Prometheus Exporter should open the connection. In case of you are usingRouterinTypethe default might be224.0.23.12:3671.PhysicalAddressThis defines the physical address how the KNX Prometheus Exporter will identify itself within your KNX address.
The MetricsPrefix defines a single string that will be added to all your exported metrics. The
format must be compliant with the
prometheus metrics names.
The AddressConfigs section defines all the information about the group addresses which should be
exported to prometheus. It contains the following structure for every exported group address.
  0/0/1:
      Name: dummy_metric
      DPT: 1.*
      Export: true
      MetricType: "counter"
      ReadActive: true
      MaxAge: 10m
      Comment: dummy comment
      Labels:
          room: office
The first line 0/0/1 defines the group address which should be exported. It can be written in all
three valid forms:
- Two layers:
0/1 - Three layers:
0/0/1 - Free structure
123
You can find more information about the formatting of group addresses here: cemi@v0.0 NewGroupAddrString
Next it defines the actual information for a single group address:
Nameis the short name of the exported metric. The format must be compliant with the prometheus metrics names.DPTThe knx data point type. This defines how the KNX Prometheus Exporter will interpret the payload of received telegrams. All available data point types can be found here: knx dptExportCan be eithertrueorfalse. Allows to disable exporting the group address as value.MetricTypedefines the type of the exported metric. Can be eithercounterorgauge. See Prometheus documentation counter vs. gauge for more information about it.ReadActivecan either betrueorfalse. If set totruethe KNX Prometheus Exporter will send aGroupValueReadtelegram to the group address to active ask for a new value if the last received value is older thanMaxAge.MaxAgedefines the maximum age of a value until the KNX Prometheus Exporter will send aGroupValueReadtelegram to active request a new value for the group address. This setting will be ignored ifReadActiveis set tofalse.Commenta short comment for the group address. Will be also exported as comment within the prometheus metrics.Labelsare additional information for a specific time series. A common usage of labels could be a labelroomwhich identifies the room for a metriccurrent_temperature.
To run the metrics export just run the following command:
knx-exporter run -f [CONFIG-FIlE]You must replace [CONFIG-FILE] with the path to your configuration file that you prepared in the
previous step. After starting the exporter you can open
http://localhost:8080/metrics to view the exported metrics.
It is also possible to run the KNX Exporter using docker. For this just run the following command:
docker run -p 8080:8080 -v [CONFIG-FILE]:/etc/knx-exporter/ga-config.yaml quay.io/chrfritz/knx-exporterAs before you must replace [CONFIG-FILE] with the path to your configuration file that you
prepared in the previous step then you can open
http://localhost:8080/metrics to view the exported metrics.
Beside exported metrics from KNX group addresses it exports some additional metrics. This metrics can be grouped into three groups:
- KNX Message Metrics: Three counter metrics which counts the number of
- received messages
knx_messages{direction="received",processed="false"} - processed received messages
knx_messages{direction="received",processed="true"}and - sent messages
knx_messages{direction="sent",processed="true"}.
- received messages
- HTTP Metrics: Counts the processed number of successfully and failed http requests. All
metrics starts with
promhttp_. - GoLang Metrics: These are metrics which indicates some health information about memory, cpu usage, threads and other GoLang internal information.
The KNX Prometheus Exporter provides endpoints for liveness and readiness checks like they were
recommended in enviroments like Kubernetes. They are reachable under /live and /ready. With
/live?full=1 and /ready?full=1 they also print the status of every single check.
- Fork it
- Download your fork to your
PC (
git clone https://github.com/your_username/knx-exporter && cd knx-exporter) - Create your feature branch (
git checkout -b my-new-feature) - Make changes and add them (
git add .) - Commit your changes (
git commit -m 'Add some feature') - Push to the branch (
git push origin my-new-feature) - Create new pull request
The KNX Exporter is released under the Apache 2.0 license. See LICENSE
Christian Fritz (@chrfritz)