I did this for the sole purpose of learning and practice three.js ages ago, there are far better and more complete solutions out there (https://plot.ly/python/3d-scatter-plots/), don't even try to use this. The code quality and everything is, due to me not having any experience back then, probably really bad.

Plots functions and .csv files. Based on three.js. It is written in ES6 syntax and compiled using Webpack.
Live Example
Click here for a live example:
http://hip70890b.de/JsPlot3D/examples/playground/index.html
You can uploade one of the csvs in /examples/csvFiles. Or get a .csv dataset (for example on kaggle.com). The live example also gives insight about the settings that can be handed over to plotCsvString, plotDataFrame, plotFormula and addDataPoints.
Info
Download: http://hip70890b.de/JsPlot3D/compiled/JsPlot3D.js
How To: If you want to start using JsPlot3D, take a look at https://github.com/sezanzeb/JsPlot3D/blob/master/USAGE.md
Documentation: https://doclets.io/sezanzeb/JsPlot3D/master ("API")
Building: https://github.com/sezanzeb/JsPlot3D/blob/master/MORE.md
Features
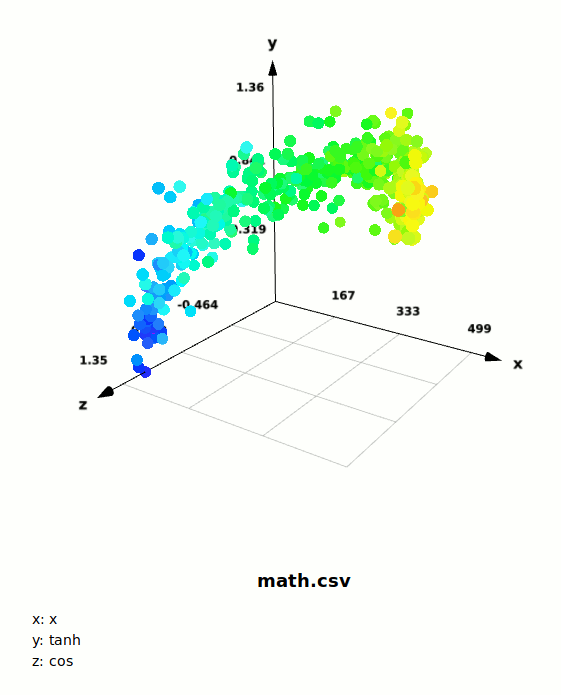
- scatterplots
- coloring labels
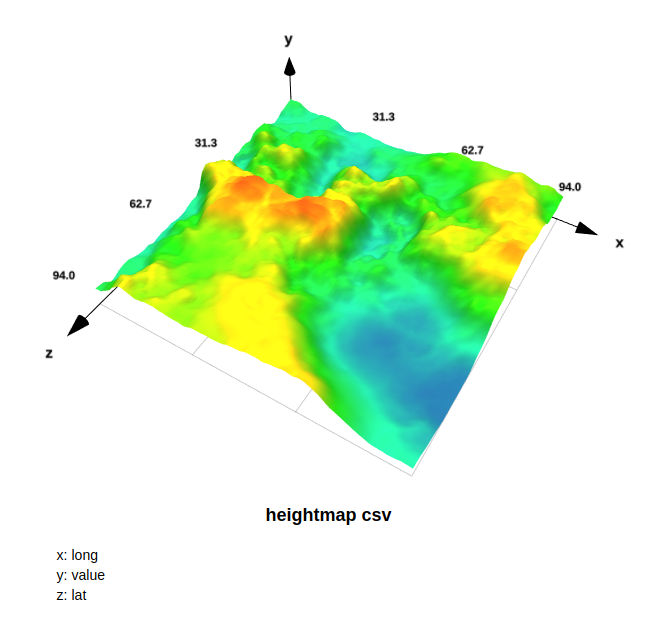
- heatmap colored datapoints
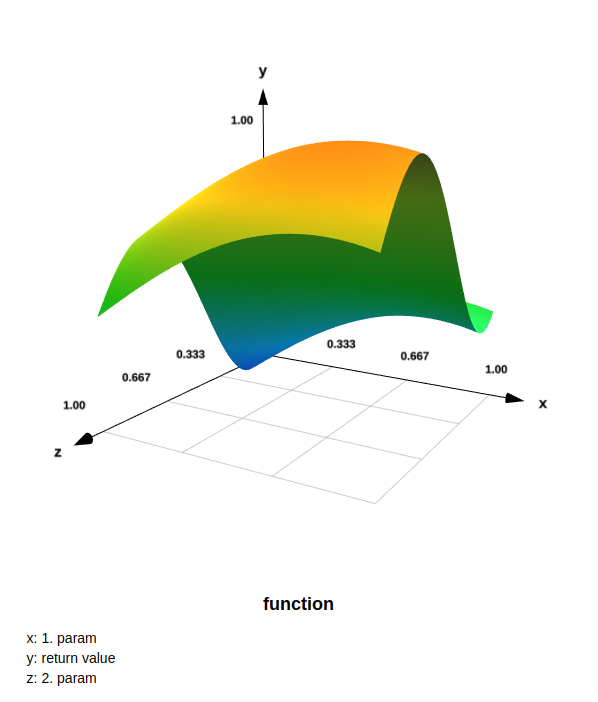
- validates and plots formulas
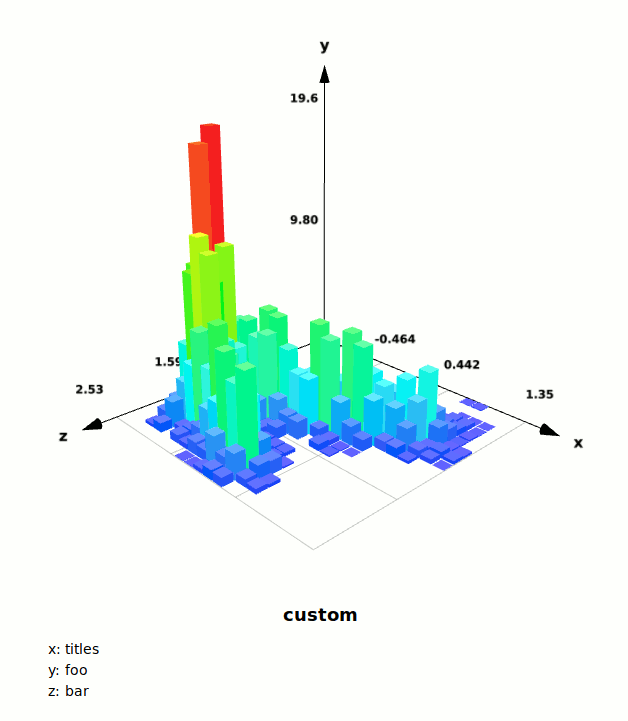
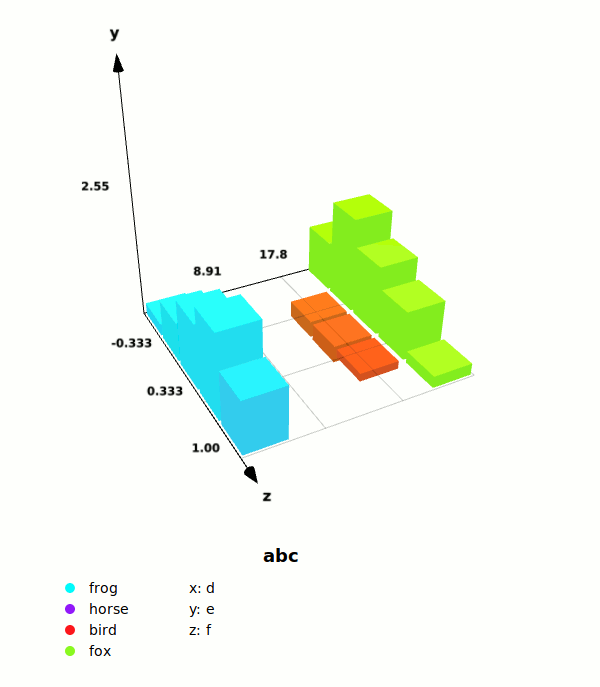
- barcharts
- placing autogenerated legends into the DOM
- optimized for adding/replacing datapoints quickly during runtime
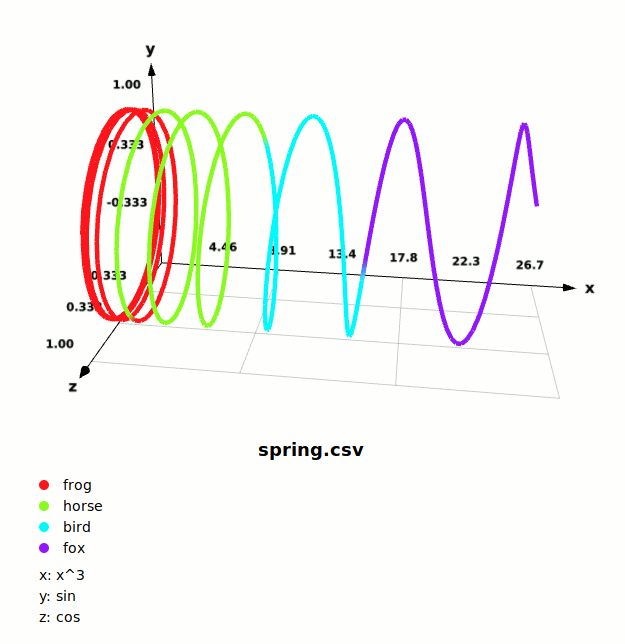
- reads .csv files
- lineplots
- 2D view
Example
You can copy the following to a file.html and open it using your browser. It should work right away and show 6 datapoints in red, blue and green and a legend below it that explainins the colors and the axes
    <div id="plot" style="width:400px; height:350px;"></div>
    <div id="legend"></div>
    <div style="display:none" id="csv">
        SepalLength,SepalWidth,PetalLength,PetalWidth,Name
        5.1,3.5,1.4,0.2,Iris-setosa
        4.9,3.0,1.4,0.2,Iris-setosa
        7.0,3.2,4.7,1.4,Iris-versicolor
        6.4,3.2,4.5,1.5,Iris-versicolor
        6.3,3.3,6.0,2.5,Iris-virginica
        5.8,2.7,5.1,1.9,Iris-virginica
    </div>
    <script src="http://threejs.org/build/three.min.js"></script>
    <script src="http://hip70890b.de/JsPlot3D/compiled/JsPlot3D.js"></script>
    <script>

        // place a canvas element inside the div with the id plot
        var plot = new JSPLOT3D.Plot(document.getElementById("plot"))

        // plot data into that canvas
        var data = document.getElementById("csv").innerHTML
        plot.plotCsvString(data, 0, 1, 2, {
            dataPointSize: 0.2,
            colorCol: 4,

            // optional, can be autodetected:
            labeled: true,
            header: true,
            separator: ","
        })

        // place the autogenerated legend somewhere
        plot.createLegend(document.getElementById("legend"))

    </script>
    <style>
        body {
            font-family: sans-serif;
        }

        .jsP3D_labelColor {
            width: 10px;
            height: 10px;
            display: inline-block;
            border-radius: 100%;
        }
    </style>