COVID-19 Data Repository by the Center for Systems Science and Engineering (CSSE) at Johns Hopkins University
- Provide COVID19 dataset containing detailed information on Russia.
- Maintain CSSE compatibility
- Provide some higher level APIs for accessing the data.
- Close the project after a more systematic approch is developed
Disclamer: the author doesn't have relationships with any government or commercial organisations. The data provided here are collected from unreliable sources and may be not accurate. Use it at your own risk.
Отказ от ответственности: автор не имеет отношения к государственным или коммерческим организациям. Данные, приведенные здесь, собраны из ненадежных источников и могут быть неточными. Используйте их на свой страх и риск.
- csse_covid_19_data/csse_covid_19_daily_reports contains CSV files which were released by CSSE and later amended by us. Files released after March 25 were updates with additional information on Russian regions.
- csse_covid_19_data/csse_covid_19_time_series folder contains additional auto-generated timeseries on Russian regions.
- python3 folder contains Python development tools:
- covid19ru.check module for checking certain invariants
- covid19ru.fetch Yandex data fetcher
- covid19ru.access Data accessor API
- covid19ru.plot Matplotlib plotting
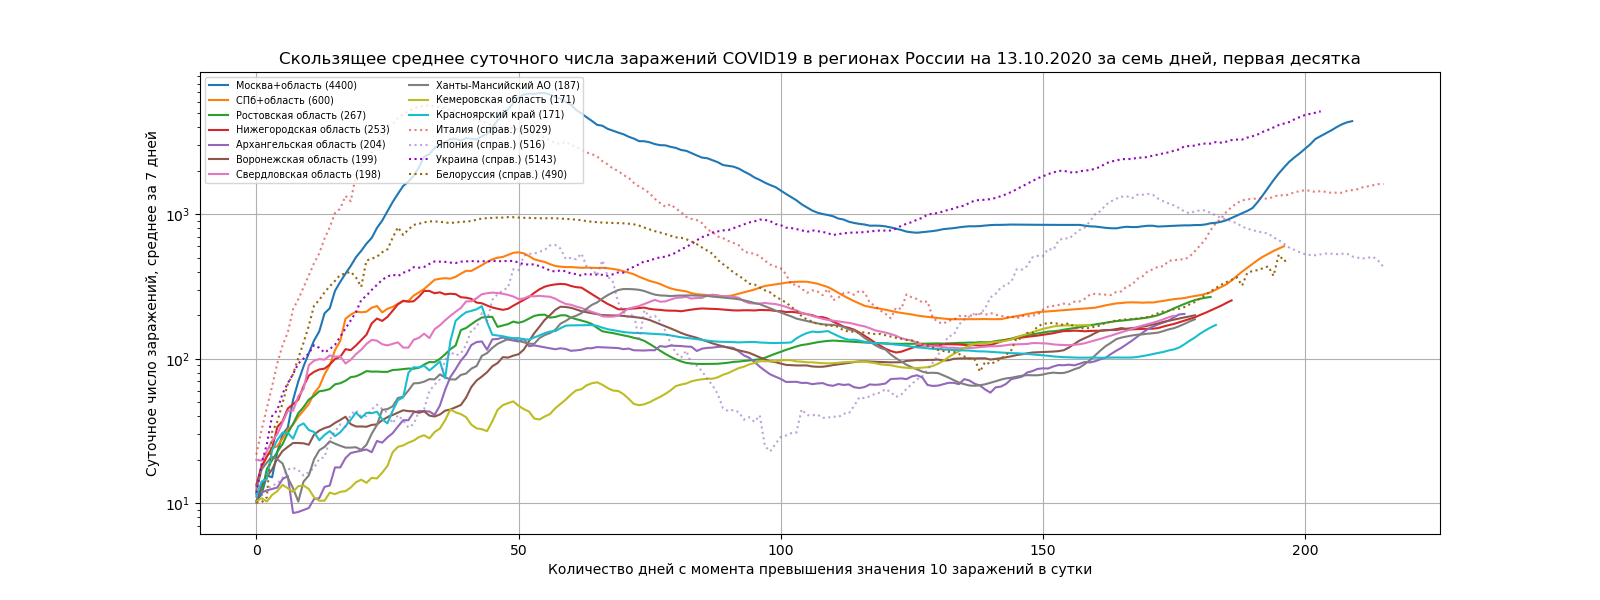
Daily cases in Russian regions, Top-10
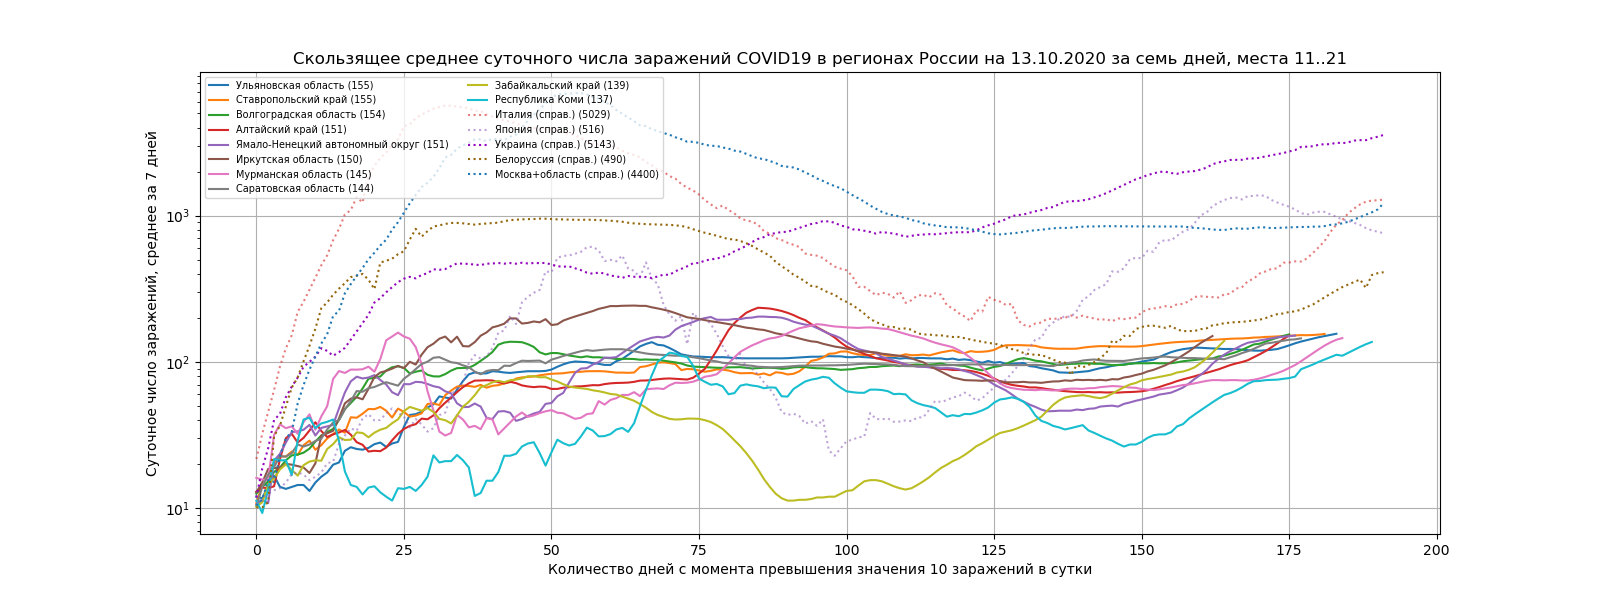
Daily cases in Russian regions, positions 11-21
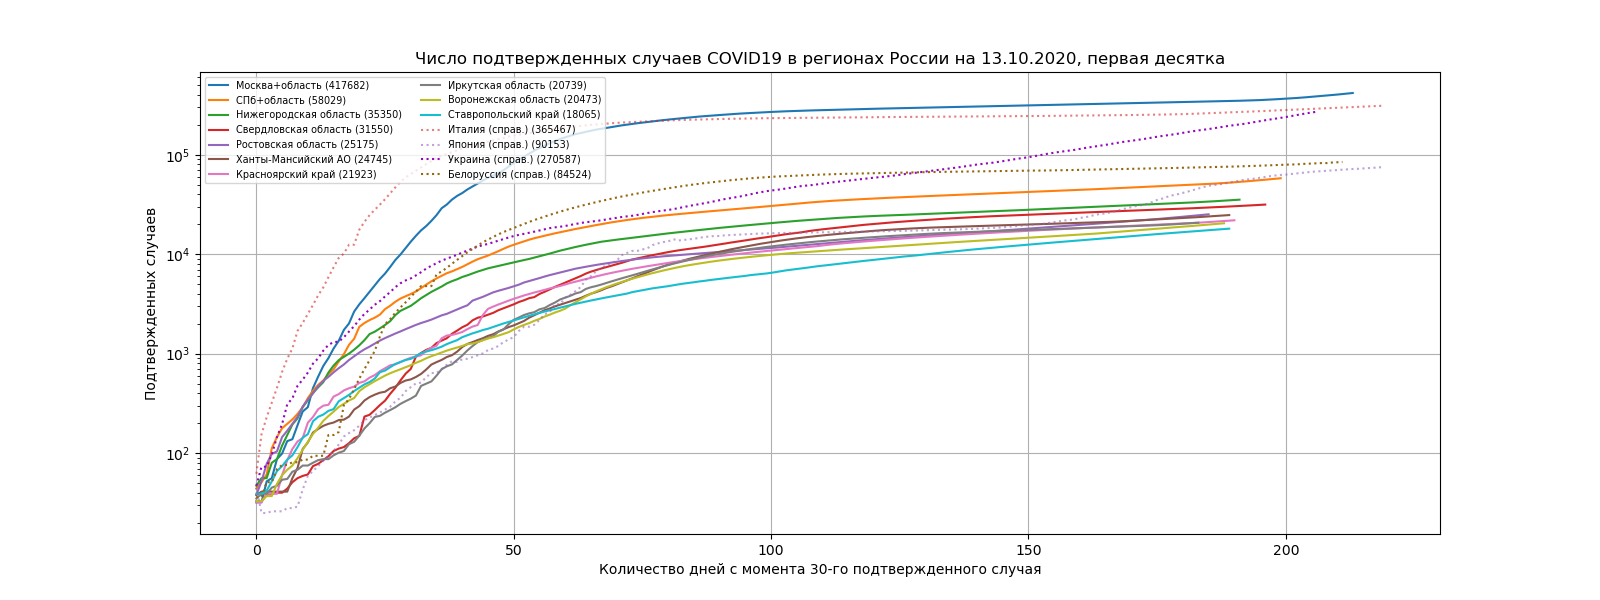
Confirmed cases in Russian regions, Top-10
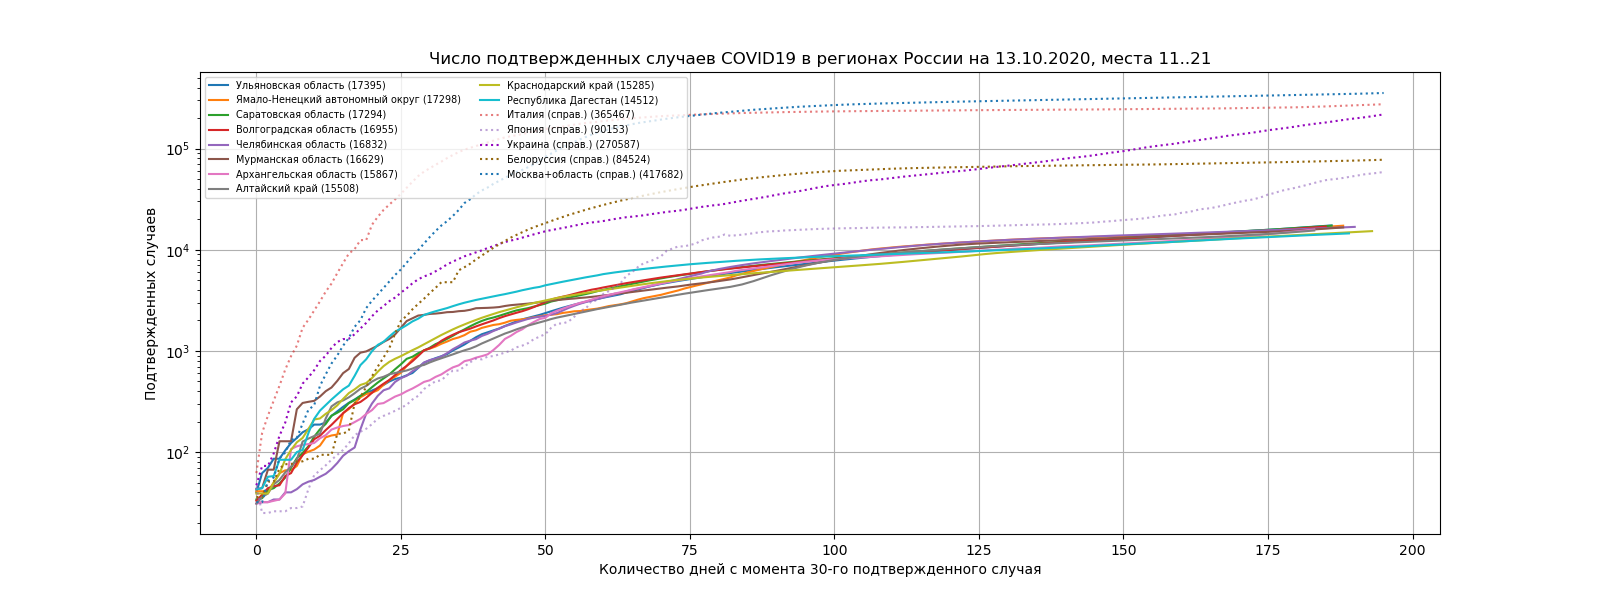
Confirmed cases in Russian regions, positions 11-21
- Yandex COVID19 map
- The Yandex company provides current per-region numbers.
- https://github.com/CSSEGISandData/COVID-19
- Upstream world data by CSSE.
- Rospotrebnadzor
- The supposedly original official data source of COVID19 data in Russia. Data is published in Russian as a plain text. The source provides daily difference per region and current total for the whole state. Example: https://www.rospotrebnadzor.ru/about/info/news/news_details.php?ELEMENT_ID=14125
- NovelCoronaVirusChannel at Telegram
- Random COVID19 news in Russian.
- https://стопкоронавирус.рф//#
- https://dash-coronavirus-2020.herokuapp.com
- https://github.com/AlexxIT/YandexCOVID
- https://github.com/klevin92/covid19_moscow_cases
- https://github.com/wolfxyx/moscow-covid-19
- https://github.com/AaronWard/covid-19-analysis
Originally, author filled the data on Moscow and Saint Petersburg manually,
based on Rospotrebnadzor and NovelCoronaVirusChannel data. Starting from
March, 25 we follow the below procedure:
- Fetch hourly data from
Yandex COVID map- Fetching is done by running
monitorfunction of the fetcher script - The data is saved into
pendingfolder, stamped with UTC time.
- Fetching is done by running
- Fetch daily upstream updates by using regular
git fetchmanually. - If update is available,
- Rebase repository to
upstream/masterbranch usinggit rebase - For every
csse_covid_19_data/csse_covid_19_daily_reportsfile which doesn't have russian details, do the following:- Determine the update time of 'Russia' record found in the world data.
The time is supposed to be UTC. The update time is often near
23:30(supposedly UTC time). - Find the russian details dump in
pendingfolder which has the closest UTC timestamp. - Update world information file by inserting russian details manually.
- Review the format compatibility (CSV fields order, date format, etc.).
- Run the checker script.
- Update RU timeline by calling
ru_timeline_dump()of access.py. - Update plots by running plot script.
- Commit the changes to this repository, forcebly push (due to rebase) here.
- Determine the update time of 'Russia' record found in the world data.
The time is supposed to be UTC. The update time is often near
- Rebase repository to
Python code to check the correctness of CSV filesPython stub checking the validity of basic CSV structure(see ./python3/src/covid19ru/check.py )Check less-trivial invariants
Python API to access the CSV data. It should handle the CSV format change which happened around 23.03.2020Pandas API(see ./python3/src/covid19ru/access.py)Provide compatibility level for data before 23.03.2020
Semi-automated data loader from Yandex. Ideally, we want to perform the following actions:Collect(starting fromConfirmed/Death/Recoveredinfo for each Russian city03-25-2020.csv)Save this information in a temporary file to handle update gapSet correct value of Longitude/Latitude for Russian regionsFigure out what does 'Active' field mean and how to get it.- Seems that it is just
Confirmed-Deaths-Recovered. One have to update the data which miss this value.
- Seems that it is just
Make periodical dumps of rospotrebnadzor cite. Try to track possible source of data inconsistency.Auto-generate timeseriesChange pre-02.06.2020 names of regions to match the upstream ones.- Daily update the dataset with information on russian regions
- Find data on Russian regions for pre- 25.03.2020 period.
- Finally changed region names to match the upstream.
- Found details on russian regions in the upstream. Looks like they started to track them as well.
- Decline in death cases in Arkhangelsk oblast. 5 deaths were reported in 01.05.2020 but only 1 death left in reports in 02.05.2020.
- Another 'resurrected' case, this time in Lipetsk oblast: deaths decreased from 4 in 28.04.2020 to 2 in 29.04.2020.
- Number of deaths decreased in Altayskiy kray from 2 in 26.04.2020 to 1 in 27.04.2020
- Shift towards future increased. File named '04-24-2020' contained data from 04-25-2020,06:30 (approximately)
- Update, this was a planned shift, ref. CSSEGISandData#2369
- Noticed that upstream published today's measurements with unusually late
timestamp. File '04-23-2020' contains stamps of
04-24-2020 03:41
- Added moving average plots
- Split the plot into
top10and10-20plots for readability.
- Got an update on Komi republic.
- Decrease of confirmed cases in Amursk oblast is detected. The number falled from 17 to 6. Local news reported about 17 confirmed cases originally: https://vostok.today/33443-koronavirus-vs-prichiny-smertnosti-v-amurskoj-oblasti-bolshe-shansov-umeret-v-dtp-ili-ot-infarkta.html
- Still no updates on Komi republic
- Added code to dump RU timeline. The up-to-date RU timeline file is available csse_covid_19_data/csse_covid_19_time_series/time_series_covid19_confirmed_RU.csv
- Also added deaths timeline csse_covid_19_data/csse_covid_19_time_series/time_series_covid19_deaths_RU.csv
- No updates on Komi republic (3rd place among Russian regions) since 10.04.2020. Checked both Yandex and Rospotrebnadzor site.
- More breaking changes from the upstream. The following daily data files have
unmatching data foramt and extra symbols in the line ends:
03-21-2020.csv03-29-2020.csv03-30-2020.csv04-06-2020.csv
- Updated issue CSSEGISandData#1523
- More errors come from checker script, this time on Crimea:
That means that Yandex counters decrease their values. We can't name the reason, probably there were some corrections. One possible reason - splitting the Crimea into
Error(file='COVID-19_plus_Russia/csse_covid_19_data/csse_covid_19_daily_reports/03-31-2020.csv', text='Confirmed decreased for Republic of Crimea from 20 to 16')CrimeaandSevastopol.
- Number of 'recovered' decreased in Sverdlovsk oblast
- Exact text of an error:
Error(file='COVID-19_plus_Russia/csse_covid_19_data/csse_covid_19_daily_reports/03-29-2020.csv',
text='Recovered decreased in Sverdlov oblast from 3 to 1 (oh no!)'),
- Conflict resolved.
23-22-2020.csvfile seemed to be damaged by the upstream admins. - CSSEGISandData#1523
- Implemented Yandex data fetcher
Upstream format change: now
,,Moscow,Russia,2020-03-24 00:00:00,55.75222,37.61556,262,1,9,,"Moscow, Russia",,"Saint Petersburg",Russia,2020-03-22 00:00:00,59.93863,30.31413,16,0,2,,"Saint Petersburg, Russia"
We augmented CSV files from csse_covid_19_daily_reports folder by adding lines
like:
Moscow,Russia,2020-03-21T00:00:00,5,0,0,55.75222,37.61556"Saint Petersburg",Russia,2020-03-21T00:00:00,4,0,2,59.93863,30.31413
Original README.md starts here
This is the data repository for the 2019 Novel Coronavirus Visual Dashboard operated by the Johns Hopkins University Center for Systems Science and Engineering (JHU CSSE). Also, Supported by ESRI Living Atlas Team and the Johns Hopkins University Applied Physics Lab (JHU APL).
Visual Dashboard (desktop): https://www.arcgis.com/apps/opsdashboard/index.html#/bda7594740fd40299423467b48e9ecf6
Visual Dashboard (mobile): http://www.arcgis.com/apps/opsdashboard/index.html#/85320e2ea5424dfaaa75ae62e5c06e61
Please cite our Lancet Article for any use of this data in a publication: An interactive web-based dashboard to track COVID-19 in real time
Provided by Johns Hopkins University Center for Systems Science and Engineering (JHU CSSE): https://systems.jhu.edu/
DONATE to the CSSE dashboard team: https://engineering.jhu.edu/covid-19/support-the-csse-covid-19-dashboard-team/
DATA SOURCES: This list includes a complete list of all sources ever used in the data set, since January 21, 2010. Some sources listed here (e.g., WHO, ECDC, US CDC, BNO News) are not currently relied upon as a source of data.
-
Aggregated data sources:
- World Health Organization (WHO): https://www.who.int/
- European Centre for Disease Prevention and Control (ECDC): https://www.ecdc.europa.eu/en/geographical-distribution-2019-ncov-cases
- DXY.cn. Pneumonia. 2020. http://3g.dxy.cn/newh5/view/pneumonia
- US CDC: https://www.cdc.gov/coronavirus/2019-ncov/index.html
- BNO News: https://bnonews.com/index.php/2020/02/the-latest-coronavirus-cases/
- WorldoMeters: https://www.worldometers.info/coronavirus/
- 1Point3Arces: https://coronavirus.1point3acres.com/en
- COVID Tracking Project: https://covidtracking.com/data. (US Testing and Hospitalization Data. We use the maximum reported value from "Currently" and "Cumulative" Hospitalized for our hospitalization number reported for each state.)
- Los Angeles Times: https://www.latimes.com/projects/california-coronavirus-cases-tracking-outbreak/
- The Mercury News: https://www.mercurynews.com/tag/coronavirus/
-
US data sources at the state (Admin1) or county/city (Admin2) level:
- Washington State Department of Health: https://www.doh.wa.gov/emergencies/coronavirus
- Maryland Department of Health: https://coronavirus.maryland.gov/
- New York State Department of Health: https://health.data.ny.gov/Health/New-York-State-Statewide-COVID-19-Testing/xdss-u53e/data
- New York City Health Department: https://www1.nyc.gov/site/doh/covid/covid-19-data.page
- NYC Department of Health and Mental Hygiene: https://www1.nyc.gov/site/doh/covid/covid-19-data.page and https://github.com/nychealth/coronavirus-data
- Florida Department of Health Dashboard: https://services1.arcgis.com/CY1LXxl9zlJeBuRZ/arcgis/rest/services/Florida_COVID19_Cases/FeatureServer/0 and https://fdoh.maps.arcgis.com/apps/opsdashboard/index.html#/8d0de33f260d444c852a615dc7837c86
- Colorado: https://covid19.colorado.gov/covid-19-data
- Virginia: https://www.vdh.virginia.gov/coronavirus/
- Northern Mariana Islands CNMI Department of Public Health: https://cnmichcc.maps.arcgis.com/apps/opsdashboard/index.html#/4061b674fc964efe84f7774b7979d2b5
- Missouri Department of Health: https://www.arcgis.com/apps/MapSeries/index.html?appid=8e01a5d8d8bd4b4f85add006f9e14a9d
- Missouri: Nodaway County: https://www.nodawaypublichealth.org/
- St. Louis City Department of Health: https://www.stlouis-mo.gov/covid-19/data/#totalsByDate
- St. Louis County: https://stlcorona.com/resources/covid-19-statistics1/
- Massachusetts: https://www.mass.gov/info-details/covid-19-response-reporting
- Michigan: https://www.michigan.gov/coronavirus/0,9753,7-406-98163_98173---,00.html
- Illinois Department of Public Health: https://dph.illinois.gov/covid19
- Indiana State Department of Health: https://hub.mph.in.gov/dataset?q=COVID
- Connecticut Department of Public Health: https://data.ct.gov/stories/s/COVID-19-data/wa3g-tfvc/
- Ohio Department of Health: https://coronavirus.ohio.gov/wps/portal/gov/covid-19/home
- Oregon Office of Emergency Management: https://experience.arcgis.com/experience/fff9f83827c5461583cd014fdf4587de
- Tennessee Department of Health: https://www.tn.gov/health/cedep/ncov.html
- Rhode Island Department of Health: https://ri-department-of-health-covid-19-data-rihealth.hub.arcgis.com/
- Wisconsin Department of Health Services: https://www.dhs.wisconsin.gov/covid-19/data.htm
- North Carolina City of Greenville GIS: https://www.arcgis.com/apps/opsdashboard/index.html#/7aeac695cafa4065ba1505b1cfa72747
- Iowa State Government: https://coronavirus.iowa.gov/
- Minnesota Department of Health: https://www.health.state.mn.us/diseases/coronavirus/situation.html
- Alabama Public Health: https://www.alabamapublichealth.gov/covid19/
- Mississippi State Department of Health: https://msdh.ms.gov/msdhsite/_static/14,0,420.html
- Nebraska Department of Health and Human Services: https://experience.arcgis.com/experience/ece0db09da4d4ca68252c3967aa1e9dd
- South Carolina Department of Health and Environmental Control: https://scdhec.gov/infectious-diseases/viruses/coronavirus-disease-2019-covid-19/sc-testing-data-projections-covid-19
- Nevada Department of Health and Human Services: https://nvhealthresponse.nv.gov/
- New Jersey Department of Health: https://covid19.nj.gov/
- Delaware Emergency Management Agency: https://coronavirus.delaware.gov/
- Utah Department of Health: https://coronavirus-dashboard.utah.gov/#overview
- Arizona Emergency Support Function (ESF)/Recovery Support Function (RSF) Operations Dashboard: https://www.arcgis.com/apps/MapSeries/index.html?appid=62e6bfa682a34e6aae9d9255ac865467
- Departamento de Salud, Puerto Rico: https://bioseguridad.maps.arcgis.com/apps/opsdashboard/index.html#/d7308c1abb4747e584329adf1215125e
- Arkansas Department of Health: https://experience.arcgis.com/experience/c2ef4a4fcbe5458fbf2e48a21e4fece9
- Maine Department of Health and Human Services: https://www.maine.gov/dhhs/mecdc/infectious-disease/epi/airborne/coronavirus/data.shtml
- Pennsylvania Department of Health: https://www.health.pa.gov/topics/disease/coronavirus/Pages/Cases.aspx
- City of Philadelphia: https://www.phila.gov/programs/coronavirus-disease-2019-covid-19/
- Lancaster County: https://covid-19-lancastercountypa.hub.arcgis.com/
- Chester County: https://chesco.maps.arcgis.com/apps/opsdashboard/index.html#/975082d579454c3ca7877db0a44e61ca
- Louisiana Department of Health: http://ldh.la.gov/coronavirus/
- Government of The District of Columbia: https://coronavirus.dc.gov/page/coronavirus-data
- North Dakota Department of Health: https://www.health.nd.gov/diseases-conditions/coronavirus/north-dakota-coronavirus-cases
- Oklahoma State Department of Health: https://looker-dashboards.ok.gov/embed/dashboards/44
- Guam Department of Public Health and Social Services: http://dphss.guam.gov/covid-19/
- New Mexico Department of Health: https://cvprovider.nmhealth.org/public-dashboard.html
- Kentucky Department of Public Health: https://kygeonet.maps.arcgis.com/apps/opsdashboard/index.html#/543ac64bc40445918cf8bc34dc40e334
- Georgia Department of Public Health: https://dph.georgia.gov/covid-19-daily-status-report
- State of Hawai'i Department of Health: https://health.hawaii.gov/coronavirusdisease2019/what-you-should-know/current-situation-in-hawaii/
- Reno County Health Department: http://reno.maps.arcgis.com/apps/opsdashboard/index.html#/dfaef27aede1414b89abf393b2ccb994
- Texas Department of State Health Services: https://dshs.texas.gov/coronavirus/
- Texas: City of San Antonio: https://covid19.sanantonio.gov/Home
- Texas: Brazioria County: https://www.brazoriacountytx.gov/departments/health-department/brazoria-county-coronavirus-map
- Texas: Brazos County Health District: http://www.brazoshealth.org
- Texas: Cameron County Public Health: https://www.cameroncounty.us/publichealth/index.php/coronavirus/
- Texas: Collin County: https://www.collincountytx.gov/healthcare_services/Pages/news.aspx
- Texas: Dallas County: https://www.dallascounty.org/departments/dchhs/2019-novel-coronavirus.php
- Texas: Denton County: https://gis-covid19-dentoncounty.hub.arcgis.com/pages/covid-19cases
- Texas: Ector County: http://www.co.ector.tx.us/page/ector.CoronavirusCOVID19
- Texas: City of El Paso: http://epstrong.org/results.php
- Texas: Fayette County: https://www.co.fayette.tx.us/
- Texas: Fort Bend County Health & Human Services: https://www.fbchealth.org/ncov/
- Texas: Galveston County Health District: https://www.gchd.org/about-us/news-and-events/coronavirus-disease-2019-covid-19/galveston-county-confirmed-covid-19-cases
- Texas: Harris County: https://publichealth.harriscountytx.gov/Resources/2019-Novel-Coronavirus
- Texas: Hays County: https://hayscountytx.com/covid-19-information-for-hays-county-residents/
- Texas: Hidalgo County Health and Human Services: https://www.hidalgocounty.us/2630/Coronavirus-Updates
- Texas: Midland County: https://www.midlandtexas.gov/955/Coronavirus-COVID-19
- Texas: Montgomery County: https://coronavirus-response-moco.hub.arcgis.com/
- Texas: City of Corpus Christi: https://www.cctexas.com/coronavirus
- Texas: Amarillo Public Health Department: https://covid-data-amarillo.hub.arcgis.com/
- Texas: Tarrant County Public Health: https://www.tarrantcounty.com/en/public-health/disease-control---prevention/coronaviruas.html
- Texas: City of Mount Pleasant: https://www.mpcity.net/632/COVID-19-UPDATES
- Texas: City of San Angelo: https://www.cosatx.us/departments-services/health-services/coronavirus-covid-19#ad-image-0
- Texas: San Angelo Standard-Times: https://www.gosanangelo.com/
- Texas: Travis County: https://www.traviscountytx.gov/news/2020/1945-novel-coronavirus-covid-19-information
- Texas: City of Laredo: https://www.cityoflaredo.com/coronavirus/
- Texas: Williamson County & Cities Health District: http://www.wcchd.org/COVID-19/dashboard.php
- California Department of Publich Health: https://www.cdph.ca.gov/covid19
- California: Mariposa County: https://www.mariposacounty.org/1592/COVID-19-Information
- California: Alameda County Public Health Department: https://covid-19.acgov.org/
- California: Fresno County Public Health Department: https://www.co.fresno.ca.us/departments/public-health/covid-19
- California: Humboldt County: https://humboldtgov.org/
- California: Madera County: https://www.maderacounty.com/government/public-health/corona-virus-covid-19/covid-revised
- California: Marin County Health & Human Services: https://coronavirus.marinhhs.org/
- California: Orange County Health Care Agency: https://occovid19.ochealthinfo.com/coronavirus-in-oc
- California: Placer County: https://www.placer.ca.gov/coronavirus
- California: Riverside County: https://www.rivcoph.org/coronavirus
- California: Sacramento County: https://www.saccounty.net/COVID-19/
- California: San Francisco Department of Public Helath: https://www.sfdph.org/dph/alerts/coronavirus.asp
- California: San Benito County Health & Human Services: https://hhsa.cosb.us/publichealth/communicable-disease/coronavirus/
- California: San Joaquin County Public Health Services: http://www.sjcphs.org/coronavirus.aspx
- California: San Mateo County: https://www.smchealth.org/coronavirus
- California: Santa Cruz County Health Services Agency: http://www.santacruzhealth.org/HSAHome/HSADivisions/PublicHealth/CommunicableDiseaseControl/CoronavirusHome.aspx
- California: Shasta County: https://www.co.shasta.ca.us/covid-19/overview
- California: Solano County: https://www.co.shasta.ca.us/covid-19/overview
- California: Sonoma County: https://socoemergency.org/emergency/novel-coronavirus/coronavirus-cases/
- California: Stanislaus County Health Services Agency: http://schsa.org/publichealth/pages/corona-virus/
- California: Ventura County: https://www.venturacountyrecovers.org/
- California: Yolo County: https://www.yolocounty.org/health-human-services/adults/communicable-disease-investigation-and-control/novel-coronavirus-2019/
- California: Los Angeles County: http://publichealth.lacounty.gov/media/coronavirus/
- California: San Diego County: https://www.sandiegocounty.gov/coronavirus.html
- California: Santa Clara County: https://www.sccgov.org/sites/covid19/
- California: Imperial County Public Health Department: http://www.icphd.org/health-information-and-resources/healthy-facts/covid-19/
- California: San Bernardino County: https://sbcovid19.com/
- Montana Department of Public Health and Human Services: https://dphhs.mt.gov/publichealth/cdepi/diseases/coronavirusmt
- South Dakota Department of Health: https://doh.sd.gov/news/coronavirus.aspx
- Wyoming Department of Health: https://health.wyo.gov/publichealth/infectious-disease-epidemiology-unit/disease/novel-coronavirus/
- New Hampshire Department of Health and Human Services: https://www.nh.gov/covid19/dashboard/summary.htm
- Idaho Government: https://coronavirus.idaho.gov/
- Virgin Islands Department of Health: https://www.covid19usvi.com/
- Vermont Department of Health: https://www.healthvermont.gov/response/coronavirus-covid-19/current-activity-vermont
- Kansas: Reno County Health Department: https://experience.arcgis.com/experience/9a7d44773e4c4a48b3e09e4d8673961b/page/page_18/
- Kansas: Kansas Department Of Health And Environment: https://www.coronavirus.kdheks.gov/160/COVID-19-in-Kansas
-
Non-US data sources at the country/region (Admin0) or state/province (Admin1) level:
- National Health Commission of the People’s Republic of China (NHC): http://www.nhc.gov.cn/xcs/yqtb/list_gzbd.shtml
- China CDC (CCDC): http://weekly.chinacdc.cn/news/TrackingtheEpidemic.htm
- Hong Kong Department of Health: https://www.chp.gov.hk/en/features/102465.html
- Macau Government: https://www.ssm.gov.mo/portal/
- Taiwan CDC: https://sites.google.com/cdc.gov.tw/2019ncov/taiwan?authuser=0
- Government of Canada: https://www.canada.ca/en/public-health/services/diseases/coronavirus.html
- Australia Government Department of Health: https://www.health.gov.au/news/coronavirus-update-at-a-glance
- COVID Live (Australia): https://www.covidlive.com.au/
- Ministry of Health Singapore (MOH): https://www.moh.gov.sg/covid-19
- Italy Ministry of Health: http://www.salute.gov.it/nuovocoronavirus
- Dati COVID-19 Italia (Italy): https://github.com/pcm-dpc/COVID-19/tree/master/dati-regioni
- French Government: https://dashboard.covid19.data.gouv.fr/ and https://github.com/opencovid19-fr/data/blob/master/dist/chiffres-cles.json
- OpenCOVID19 France: https://github.com/opencovid19-fr
- Palestine (West Bank and Gaza): https://corona.ps/details
- Israel: https://govextra.gov.il/ministry-of-health/corona/corona-virus/
- National Institute of Health of Kosovo: https://corona-ks.info/?lang=en and https://raw.githubusercontent.com/bgeVam/Kosovo-Coronatracker-Data/master/data.json
- Berliner Morgenpost (Germany): https://interaktiv.morgenpost.de/corona-virus-karte-infektionen-deutschland-weltweit/
- rtve (Spain): https://www.rtve.es/noticias/20200514/mapa-del-coronavirus-espana/2004681.shtml
- Ministry of Health, Republic of Serbia: https://covid19.rs/homepage-english/
- Chile: https://www.minsal.cl/nuevo-coronavirus-2019-ncov/casos-confirmados-en-chile-covid-19/
- Chile: https://www.gob.cl/coronavirus/cifrasoficiales/
- Brazil Ministry of Health: https://covid.saude.gov.br/
- Brazil: https://github.com/wcota/covid19br. Data described in DOI: 10.1590/SciELOPreprints.362
- Gobierono De Mexico:https://covid19.sinave.gob.mx/
- Japan COVID-19 Coronavirus Tracker: https://covid19japan.com/#all-prefectures
- Monitoreo del COVID-19 en Perú - Policía Nacional del Perú (PNP) - Dirección de Inteligencia (DIRIN): https://www.arcgis.com/apps/opsdashboard/index.html#/f90a7a87af2548699d6e7bb72f5547c2 and Ministerio de Salud del Perú: https://covid19.minsa.gob.pe/sala_situacional.asp
- Colombia National Institute of Health: http://www.ins.gov.co/Noticias/Paginas/Coronavirus.aspx
- Russia: https://xn--80aesfpebagmfblc0a.xn--p1ai/information/
- Ukraine: https://covid19.rnbo.gov.ua/
- Public Health Agency of Sweden: https://experience.arcgis.com/experience/09f821667ce64bf7be6f9f87457ed9aa
- Government of India: https://www.mygov.in/covid-19
- Government of Pakistan: http://covid.gov.pk/stats/pakistan
- The UK Government: https://coronavirus.data.gov.uk/#category=nations&map=rate
- Scottish Government: https://www.gov.scot/publications/coronavirus-covid-19-trends-in-daily-data/
- Netherlands National Institute for Health and Environment: https://experience.arcgis.com/experience/ea064047519040469acb8da05c0f100d
- Iceland Directorate of Health and Department of Civil Protection and Emergency Management: https://www.covid.is/data
- Luxembourg Government Ministry of Health: https://msan.gouvernement.lu/en/graphiques-evolution.html
Embed our dashboard into your webpage:
<style>.embed-container {position: relative; padding-bottom: 80%; height: 0; max-width: 100%;} .embed-container iframe, .embed-container object, .embed-container iframe{position: absolute; top: 0; left: 0; width: 100%; height: 100%;} small{position: absolute; z-index: 40; bottom: 0; margin-bottom: -15px;}</style><div class="embed-container"><iframe width="500" height="400" frameborder="0" scrolling="no" marginheight="0" marginwidth="0" title="COVID-19" src="https://www.arcgis.com/apps/opsdashboard/index.html#/bda7594740fd40299423467b48e9ecf6"></iframe></div>Acknowledgements: We are grateful to the following organizations for supporting our Center’s COVID-19 mapping and modeling efforts: Financial Support: Johns Hopkins University, National Science Foundation (NSF), Bloomberg Philanthropies, Stavros Niarchos Foundation; Resource support: AWS, Slack, Github; Technical support: Johns Hopkins Applied Physics Lab (APL), Esri Living Atlas team
Additional Information about the Visual Dashboard: https://systems.jhu.edu/research/public-health/ncov/
Contact Us:
- Email: jhusystems@gmail.com
Terms of Use:
-
This data set is licensed under the Creative Commons Attribution 4.0 International (CC BY 4.0) by the Johns Hopkins University on behalf of its Center for Systems Science in Engineering. Copyright Johns Hopkins University 2020.
-
Attribute the data as the "COVID-19 Data Repository by the Center for Systems Science and Engineering (CSSE) at Johns Hopkins University" or "JHU CSSE COVID-19 Data" for short, and the url: https://github.com/CSSEGISandData/COVID-19.
-
For publications that use the data, please cite the following publication: "Dong E, Du H, Gardner L. An interactive web-based dashboard to track COVID-19 in real time. Lancet Inf Dis. 20(5):533-534. doi: 10.1016/S1473-3099(20)30120-1"


