PH planning to mitigate the impending grey tsunami
The purpose of this report is to help Pewlett Hackard (PH) weather the fast approaching "silver tsunami," which is the retirement of thousands of people who will need to be replaced promptly if the operations at PH are not to suffer any disruptions due to the shortfall of the required skilled labour. The first part of this report will focus on determining the number of retiring employees grouped by business title. In order to achieve a smooth transition from older employees to newer employees, a mentoring plan needs to be implemented. The second part of this report focuses on identifying the mentorship-eligible staff, those who would be tasked with mentoring junior staff.
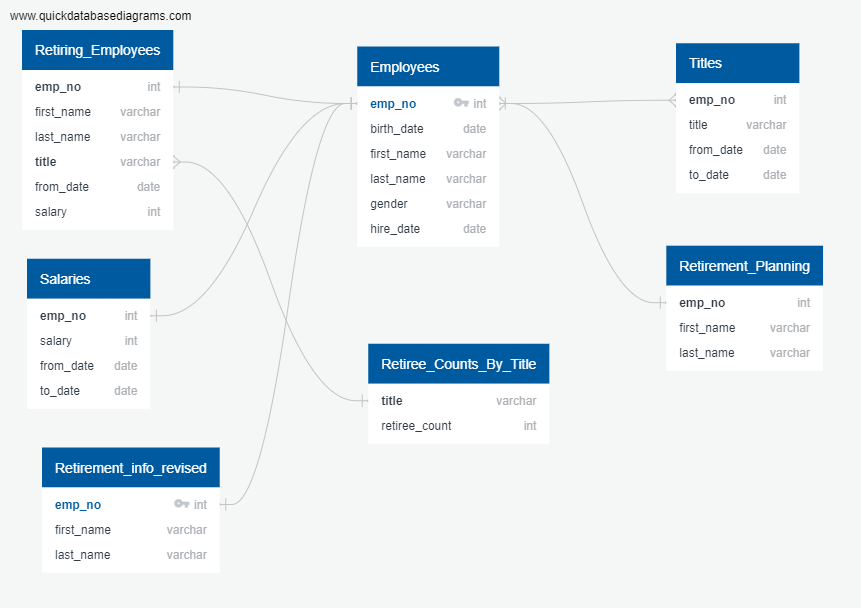
The query that was used to determine the number of retiring employees by job title was created by querying the retiring_employees table and then grouping by title.
The retiring_employees query, which returns a list of all the retirement-eligible employees, was created by joining the following tables:
- the
employeestable and thesalarytable, which were originally provided as csv files, and - the
retirement_info_revisedtable which was created during the course of the class work.
The retirement_info_revised table was created using the retirement_info table and then adding the emp_no column which is necessary to join it to the other two tables. The SQL script that was used to create the retirement_info_revised is the following:
SELECT emp_no, first_name, last_name
INTO retirement_info_revised
FROM employees
WHERE (birth_date BETWEEN '1952-01-01' AND '1955-12-31')
AND (hire_date BETWEEN '1985-01-01' AND '1988-12-31');
In order to group the employees based on title, retiree_counts_by_title was created. The following table shows the results of the retiree_counts_by_title query (also found in this csv file):
| title | retiree_count |
|---|---|
| Assistant Engineer | 251 |
| Engineer | 2711 |
| Manager | 2 |
| Senior Engineer | 13651 |
| Senior Staff | 12872 |
| Staff | 2022 |
| Technique Leader | 1609 |
This section of the report explores the hiring trends at PH. Tables have been generated for hiring trends per month-of-year, hiring trends per title per month-of-year, hiring trends per year, and hiring trends per title per year. THe following are the results.
The query that was used to determine the trends per month of year can be viewed here.
| hire_month | hire_num |
|---|---|
| 03 | 26917 |
| 05 | 25943 |
| 07 | 25605 |
| 04 | 25553 |
| 08 | 25396 |
| 06 | 25003 |
| 10 | 24613 |
| 12 | 24509 |
| 02 | 24448 |
| 09 | 24316 |
| 11 | 23862 |
| 01 | 23859 |

Conclusion
There doesn't appear to be a significant difference in the hiring trends related to the month of year.
The following table was created showing the total monthly hiring numbers, grouped by department/title. The table that was returned, in descending order, by number of hires per month of year, is the following:
| department | hire_month | hire_num |
|---|---|---|
| Development | 03 | 7788 |
| Development | 05 | 7481 |
| Development | 07 | 7358 |
| Development | 04 | 7245 |
| Development | 06 | 7219 |
| Development | 08 | 7182 |
| Development | 10 | 7041 |
| Development | 02 | 6974 |
| Development | 12 | 6914 |
| Development | 09 | 6854 |
| Development | 11 | 6851 |
| Development | 01 | 6800 |
| Production | 03 | 6511 |
| Production | 04 | 6329 |
| Production | 05 | 6321 |
| Production | 07 | 6284 |
| Production | 08 | 6190 |
| Production | 06 | 6176 |
| Production | 09 | 6055 |
| Production | 12 | 6000 |
| Production | 10 | 5985 |
| Production | 02 | 5927 |
| Production | 11 | 5908 |
| Production | 01 | 5799 |
| Sales | 03 | 4769 |
| Sales | 08 | 4488 |
| Sales | 05 | 4482 |
| Sales | 04 | 4469 |
| Sales | 07 | 4397 |
| Sales | 10 | 4310 |
| Sales | 12 | 4278 |
| Sales | 06 | 4273 |
| Sales | 02 | 4238 |
| Sales | 11 | 4207 |
| Sales | 01 | 4192 |
| Sales | 09 | 4142 |
| Customer Service | 05 | 2099 |
| Customer Service | 07 | 2067 |
| Customer Service | 08 | 2039 |
| Customer Service | 03 | 2009 |
| Customer Service | 04 | 2000 |
| Customer Service | 01 | 1990 |
| Customer Service | 02 | 1942 |
| Customer Service | 10 | 1932 |
| Customer Service | 09 | 1931 |
| Research | 03 | 1900 |
| Customer Service | 06 | 1896 |
| Quality Management | 03 | 1883 |
| Customer Service | 12 | 1864 |
| Research | 04 | 1861 |
| Marketing | 03 | 1856 |
| Research | 08 | 1814 |
| Customer Service | 11 | 1811 |
| Research | 12 | 1792 |
| Quality Management | 07 | 1791 |
| Marketing | 08 | 1780 |
| Research | 05 | 1763 |
| Research | 07 | 1760 |
| Quality Management | 05 | 1753 |
| Research | 06 | 1749 |
| Marketing | 05 | 1743 |
| Research | 02 | 1739 |
| Marketing | 04 | 1739 |
| Research | 10 | 1728 |
| Marketing | 12 | 1703 |
| Research | 01 | 1695 |
| Quality Management | 04 | 1685 |
| Research | 09 | 1672 |
| Quality Management | 08 | 1668 |
| Quality Management | 10 | 1665 |
| Marketing | 06 | 1664 |
| Quality Management | 06 | 1658 |
| Research | 11 | 1653 |
| Marketing | 09 | 1652 |
| Marketing | 10 | 1642 |
| Marketing | 07 | 1642 |
| Quality Management | 09 | 1634 |
| Marketing | 11 | 1625 |
| Quality Management | 02 | 1617 |
| Quality Management | 01 | 1615 |
| Quality Management | 12 | 1610 |
| Marketing | 02 | 1584 |
| Marketing | 01 | 1581 |
| Finance | 05 | 1542 |
| Human Resources | 03 | 1542 |
| Quality Management | 11 | 1538 |
| Human Resources | 09 | 1528 |
| Human Resources | 07 | 1528 |
| Human Resources | 08 | 1516 |
| Finance | 03 | 1506 |
| Finance | 07 | 1499 |
| Human Resources | 05 | 1495 |
| Human Resources | 12 | 1494 |
| Human Resources | 04 | 1489 |
| Finance | 02 | 1489 |
| Human Resources | 02 | 1483 |
| Human Resources | 06 | 1476 |
| Finance | 10 | 1462 |
| Finance | 08 | 1453 |
| Finance | 12 | 1432 |
| Human Resources | 11 | 1431 |
| Finance | 04 | 1431 |
| Human Resources | 10 | 1421 |
| Finance | 06 | 1402 |
| Finance | 01 | 1400 |
| Finance | 09 | 1394 |
| Human Resources | 01 | 1383 |
| Finance | 11 | 1336 |
The bar graphs showing the trends for each title are the following:


As with Hiring trends per month of year, there does not appear to be a significant difference beteen the hiring trends with regard to month-of-year for all departments.
Numbers were also gathered for number of hires per year over the last number of years. The following table shows the year along with the number of hires for that year:
| hire_year | hire_num |
|---|---|
| 1986 | 36150 |
| 1985 | 35316 |
| 1987 | 33501 |
| 1988 | 31436 |
| 1989 | 28394 |
| 1990 | 25610 |
| 1991 | 22568 |
| 1992 | 20402 |
| 1993 | 17772 |
| 1994 | 14835 |
| 1995 | 12115 |
| 1996 | 9574 |
| 1997 | 6669 |
| 1998 | 4155 |
| 1999 | 1514 |
| 2000 | 13 |
And the corresponding bar graph is the following:

Conclusion
It appears that there was a slight right in hiring numbers on 1986 immediately followed a steady downward trend that lasted through the years 1988 to 2000, at which point hiring has all but ceased.
The following table was created showing the total yearly hiring numbers, grouped by department/title. The table that was returned, in descending order, by number of hires per year, is the following:
| department | hire_year | hire_num |
|---|---|---|
| Customer Service | 1985 | 2700 |
| Customer Service | 1986 | 2949 |
| Customer Service | 1987 | 2585 |
| Customer Service | 1988 | 2508 |
| Customer Service | 1989 | 2237 |
| Customer Service | 1990 | 2016 |
| Customer Service | 1991 | 1812 |
| Customer Service | 1992 | 1534 |
| Customer Service | 1993 | 1441 |
| Customer Service | 1994 | 1170 |
| Customer Service | 1995 | 926 |
| Customer Service | 1996 | 718 |
| Customer Service | 1997 | 525 |
| Customer Service | 1998 | 338 |
| Customer Service | 1999 | 120 |
| Customer Service | 2000 | 1 |
| Development | 1985 | 10174 |
| Development | 1986 | 10237 |
| Development | 1987 | 9559 |
| Development | 1988 | 8885 |
| Development | 1989 | 8152 |
| Development | 1990 | 7322 |
| Development | 1991 | 6390 |
| Development | 1992 | 5946 |
| Development | 1993 | 5059 |
| Development | 1994 | 4233 |
| Development | 1995 | 3501 |
| Development | 1996 | 2743 |
| Development | 1997 | 1918 |
| Development | 1998 | 1150 |
| Development | 1999 | 435 |
| Development | 2000 | 3 |
| Finance | 1985 | 2044 |
| Finance | 1986 | 2128 |
| Finance | 1987 | 1934 |
| Finance | 1988 | 1790 |
| Finance | 1989 | 1684 |
| Finance | 1990 | 1434 |
| Finance | 1991 | 1324 |
| Finance | 1992 | 1192 |
| Finance | 1993 | 1001 |
| Finance | 1994 | 875 |
| Finance | 1995 | 699 |
| Finance | 1996 | 534 |
| Finance | 1997 | 376 |
| Finance | 1998 | 241 |
| Finance | 1999 | 89 |
| Finance | 2000 | 1 |
| Human Resources | 1985 | 2052 |
| Human Resources | 1986 | 2169 |
| Human Resources | 1987 | 1982 |
| Human Resources | 1988 | 1835 |
| Human Resources | 1989 | 1676 |
| Human Resources | 1990 | 1497 |
| Human Resources | 1991 | 1415 |
| Human Resources | 1992 | 1182 |
| Human Resources | 1993 | 1027 |
| Human Resources | 1994 | 925 |
| Human Resources | 1995 | 720 |
| Human Resources | 1996 | 583 |
| Human Resources | 1997 | 383 |
| Human Resources | 1998 | 251 |
| Human Resources | 1999 | 85 |
| Human Resources | 2000 | 4 |
| Marketing | 1985 | 2400 |
| Marketing | 1986 | 2361 |
| Marketing | 1987 | 2238 |
| Marketing | 1988 | 2156 |
| Marketing | 1989 | 1883 |
| Marketing | 1990 | 1692 |
| Marketing | 1991 | 1581 |
| Marketing | 1992 | 1376 |
| Marketing | 1993 | 1232 |
| Marketing | 1994 | 1047 |
| Marketing | 1995 | 769 |
| Marketing | 1996 | 600 |
| Marketing | 1997 | 461 |
| Marketing | 1998 | 302 |
| Marketing | 1999 | 111 |
| Marketing | 2000 | 2 |
| Production | 1985 | 8788 |
| Production | 1986 | 8887 |
| Production | 1987 | 8161 |
| Production | 1988 | 7786 |
| Production | 1989 | 6796 |
| Production | 1990 | 6383 |
| Production | 1991 | 5490 |
| Production | 1992 | 4973 |
| Production | 1993 | 4278 |
| Production | 1994 | 3590 |
| Production | 1995 | 2998 |
| Production | 1996 | 2364 |
| Production | 1997 | 1628 |
| Production | 1998 | 1003 |
| Production | 1999 | 358 |
| Production | 2000 | 2 |
| Quality Management | 1985 | 2381 |
| Quality Management | 1986 | 2367 |
| Quality Management | 1987 | 2288 |
| Quality Management | 1988 | 2107 |
| Quality Management | 1989 | 1914 |
| Quality Management | 1990 | 1695 |
| Quality Management | 1991 | 1461 |
| Quality Management | 1992 | 1341 |
| Quality Management | 1993 | 1201 |
| Quality Management | 1994 | 1008 |
| Quality Management | 1995 | 817 |
| Quality Management | 1996 | 712 |
| Quality Management | 1997 | 446 |
| Quality Management | 1998 | 272 |
| Quality Management | 1999 | 106 |
| Quality Management | 2000 | 1 |
| Research | 1985 | 2522 |
| Research | 1986 | 2548 |
| Research | 1987 | 2328 |
| Research | 1988 | 2228 |
| Research | 1989 | 1976 |
| Research | 1990 | 1792 |
| Research | 1991 | 1587 |
| Research | 1992 | 1434 |
| Research | 1993 | 1240 |
| Research | 1994 | 1051 |
| Research | 1995 | 852 |
| Research | 1996 | 679 |
| Research | 1997 | 489 |
| Research | 1998 | 295 |
| Research | 1999 | 105 |
| Sales | 1985 | 6019 |
| Sales | 1986 | 6359 |
| Sales | 1987 | 5855 |
| Sales | 1988 | 5410 |
| Sales | 1989 | 5030 |
| Sales | 1990 | 4497 |
| Sales | 1991 | 3874 |
| Sales | 1992 | 3561 |
| Sales | 1993 | 3188 |
| Sales | 1994 | 2564 |
| Sales | 1995 | 2131 |
| Sales | 1996 | 1635 |
| Sales | 1997 | 1149 |
| Sales | 1998 | 710 |
| Sales | 1999 | 262 |
| Sales | 2000 | 1 |
The bar graphs showing the yearly trend per title are the following:


As was observed from the overall yearly hiring trends, it can be observed from the per-title yearly trends that, with the exception of 1986, there is a steady decline in hiring across the departments.
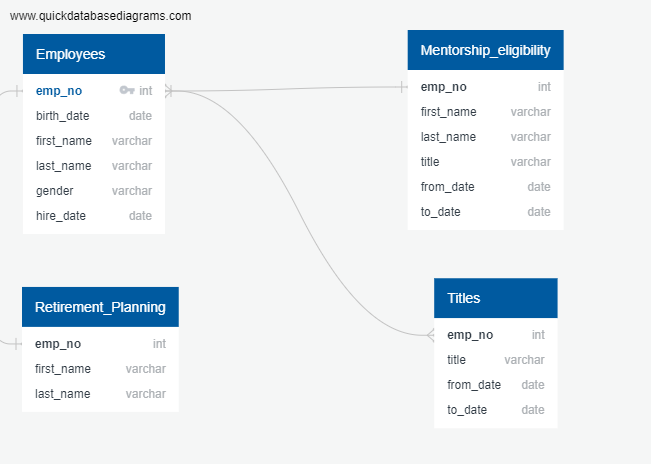
In order to determine mentorship eligibility, the following tables were used:
employeesandtitlesthat were original provided as csv filesretirement planning, a table which lists the employee numbers, and first and last names of the employees, who are not yet due to retire but who have enough experience to be able to mentor junior employees, which was created using the following script:
DROP TABLE IF EXISTS retirement_planning;

-- Creating new table with SQL
SELECT e.emp_no, first_name, last_name
INTO retirement_planning
FROM employees e
INNER JOIN titles t
ON t.emp_no = e.emp_no
WHERE (birth_date BETWEEN '1965-01-01' AND '1965-12-31')
AND t.to_date = '9999-01-01'  -- Presently employed;
That returns a list of 1,549 employees.
The total number of tables, that were created as a result of loading the original CSV files and those that were created and modified by joining the already provided tables, was twelve tables.
Due to the restriction of the quickdatabasedesign website that does display the ERD for more than 10 named tables, the remaining tables are generically named "table 11","table 12",etc, it was necessary to split up the ERD into three parts:
-
Retiree Count Per Title
-
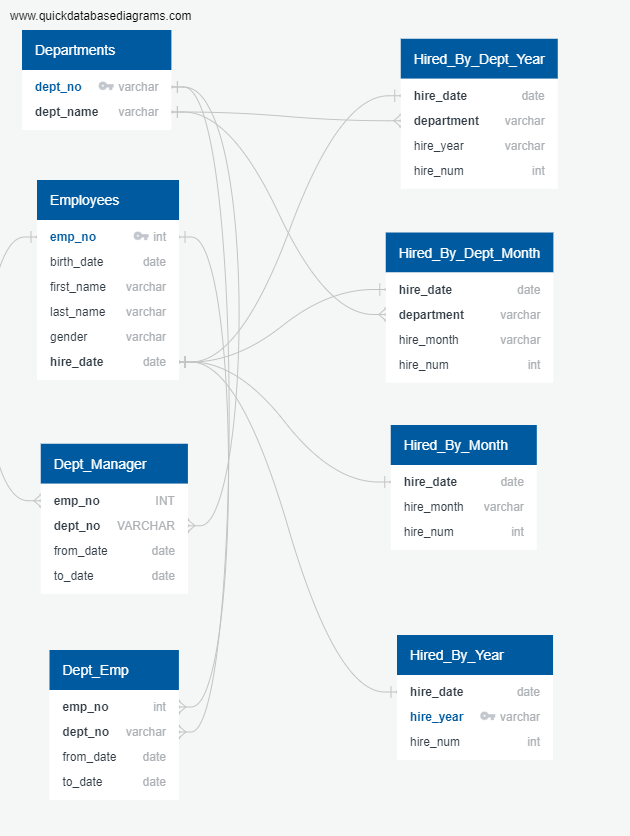
Hiring Trends per Title per year
-
Mentorship Eligibility


The requirements for this assignment were quite vague and the tools that were available for use were a limiting factor in the successful completion of the work. My recommendation is to make the requirements clearer, and to limit the scope of the assignment or make sure that the students have adequate tools to accomplish the required work.