svibuildr
![]()

![]()
![]()
svibuildr is an R package that allows users to download or construct
Social Vulnerability Index datasets as tidyverse dataframes or as simple
features dataframes for spatial analyses. Users can choose to download
precompiled datasets from the
CDC
or compile the SVI with data from the US Census Bureau’s American
Community Survey.
Pre-compiled SVI data is only available for individual states or as a
single SVI for the entire nation. Downloading raw Census data and
compiling the SVI with svibuildr allows users to construct an SVI for
any study area in the US. For example, one could calculate the SVI for a
study area consisting of three states in which SVI scores are calculated
by comparing values across counties in just the three states rather than
across all 50 states:
library(svibuildr)

tri_state_svi <- calculate_svi(
    geography = "county", year = 2020, state = c("ME", "NH", "VT")
)
Currently, calculating the SVI is only available for the year 2020 using the updated method published by the CDC/ATSDR [1].
This package utilizes the tidycensus package to interface with the US Census Bureau API and download the data for compiling the SVI [2].
Note: This package is not endorsed or developed by the CDC/ATSDR nor has it undergone peer-review. For official documentation, publications, and other information, please visit the official Social Vulnerability Index web page at https://www.atsdr.cdc.gov/placeandhealth/svi/index.html.
Installation
svibuildr can be installed from this repositority using:
```r
install.packages('devtools')
devtools::install_github('sebastianrowan/svibuildr')
```
Validation
Using svibuildr to generate the Social Vulnerability Index for a
single state reveals that there are slight discrepencies between the
index scores calculated in R and the values provided when downloading
the data directly from the CDC website. I believe these discrepancies
are due to differences in how rounding is handled in R versus Excel
which appears to be the tool used by CDC to generate the datasets on
their website.
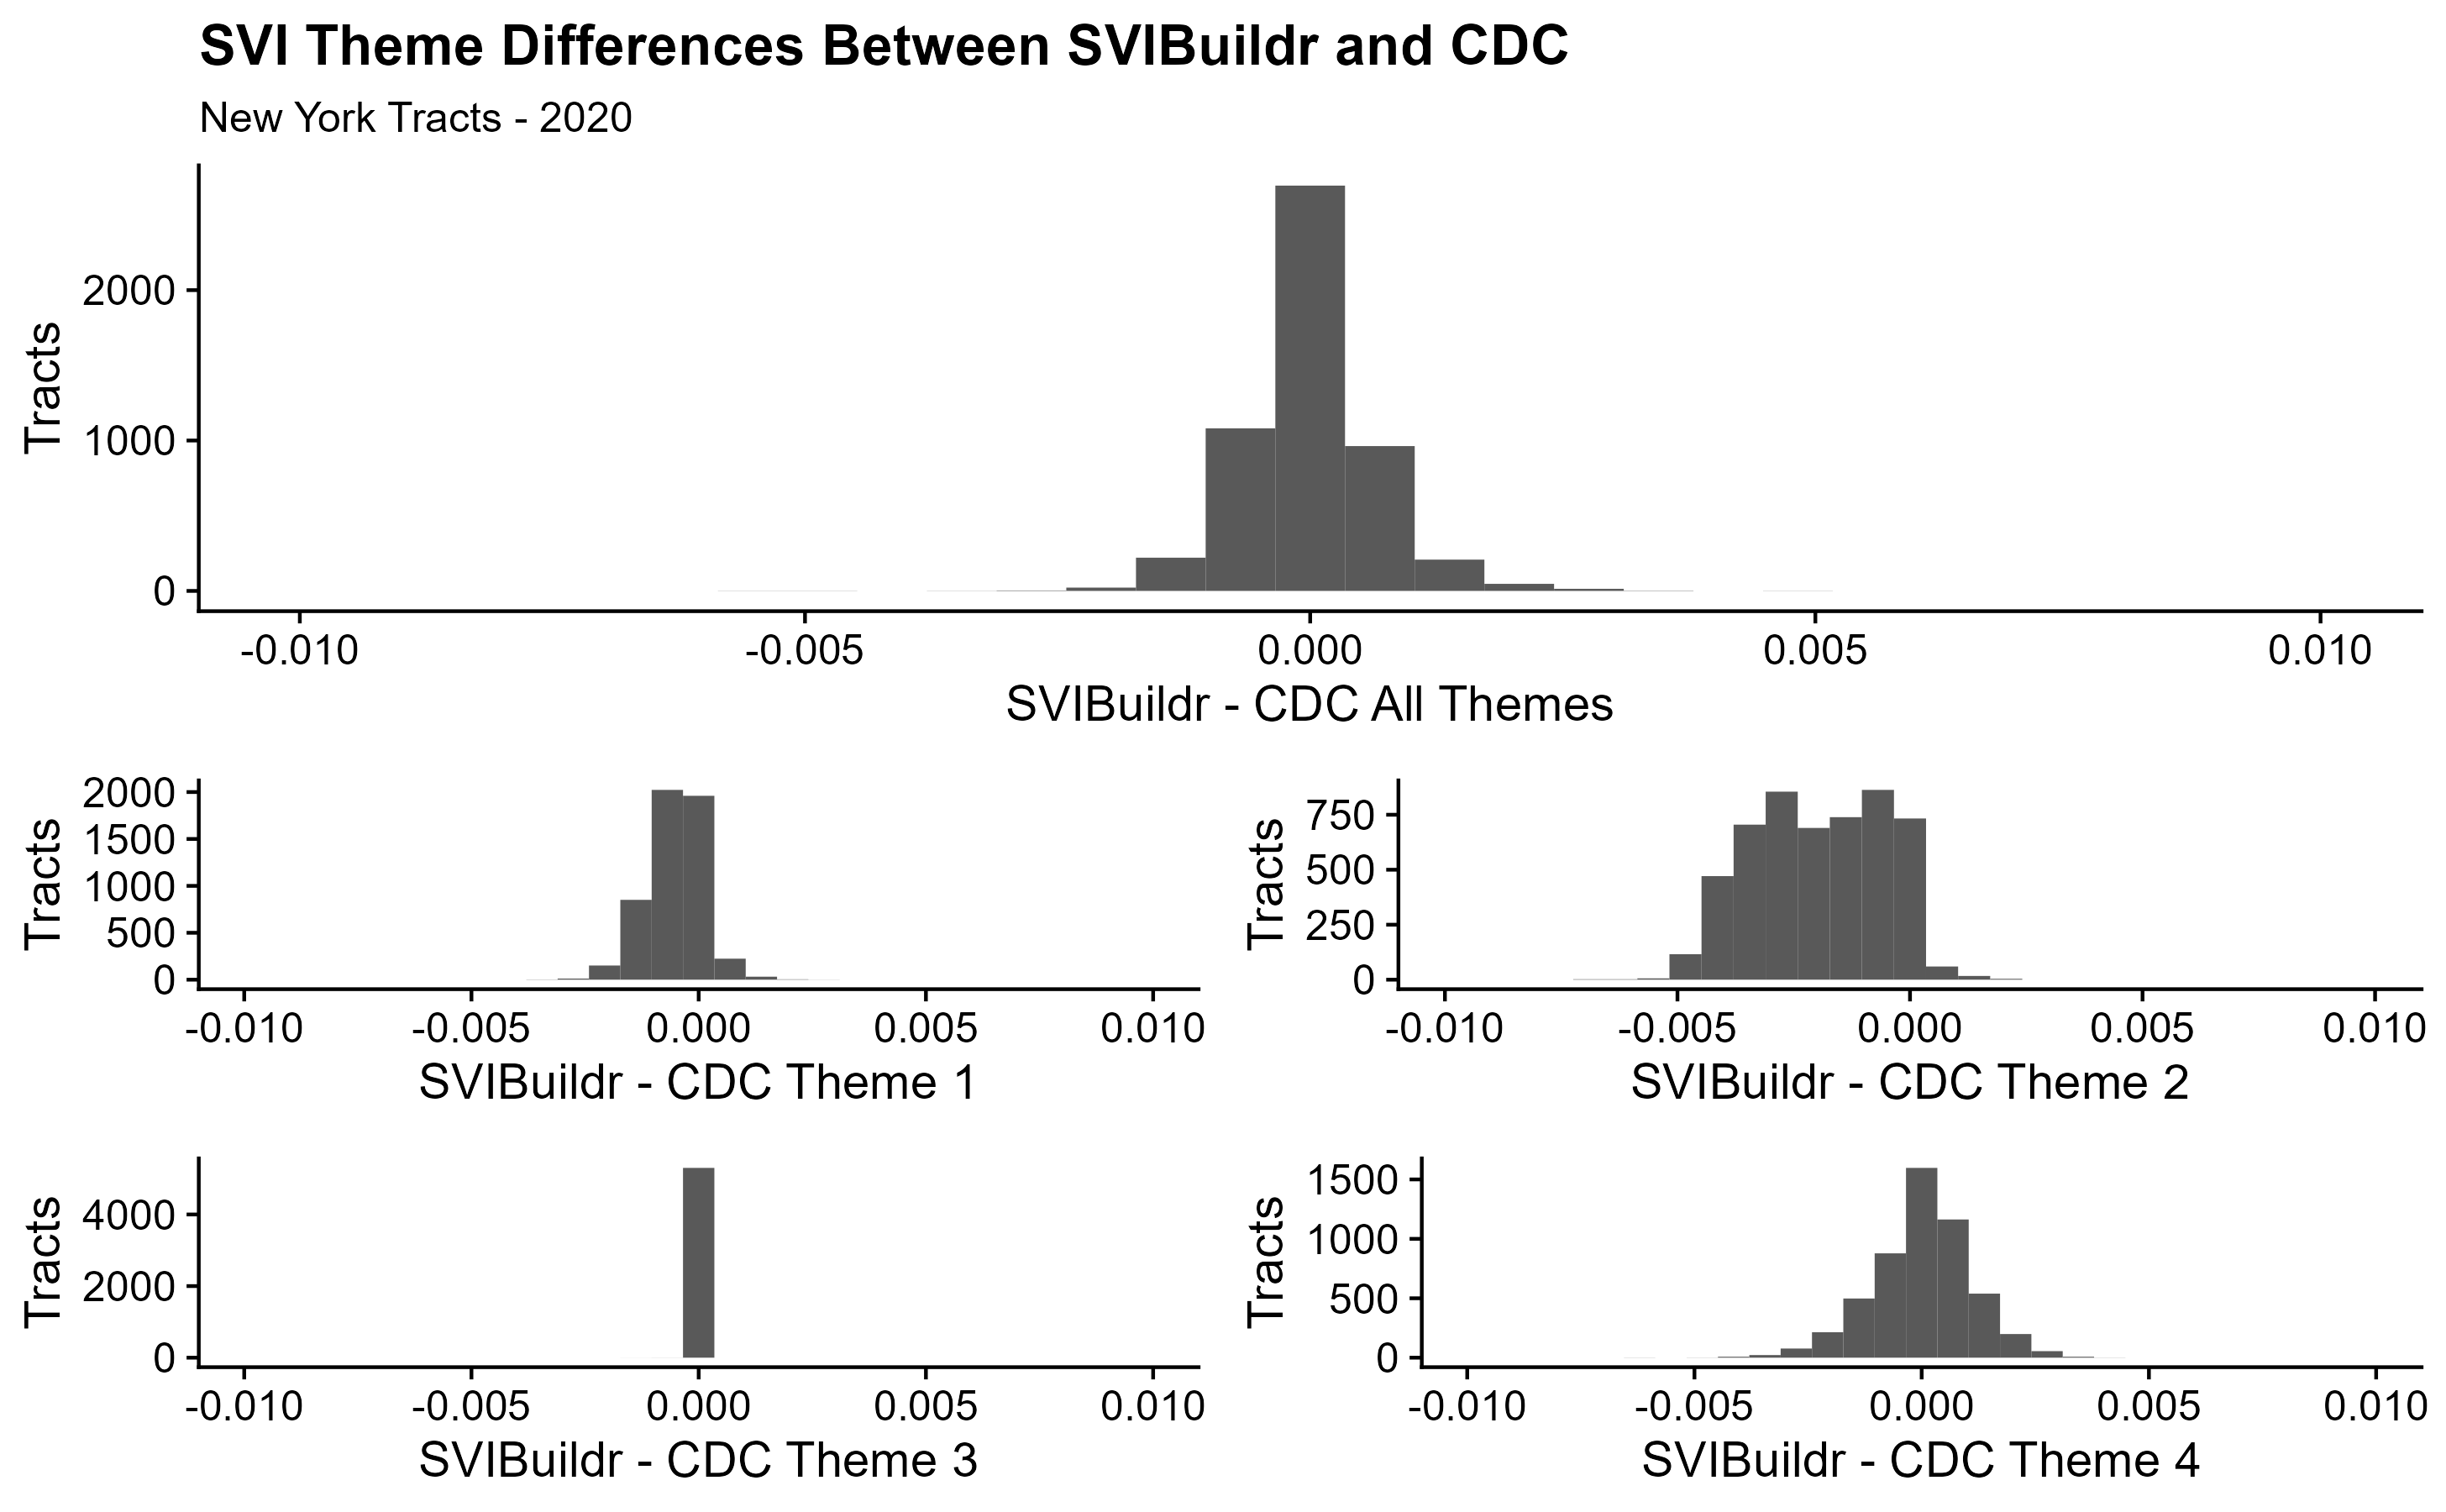
I have manually compared rankings across all four themes as well as the overall SVI ranking at the tract and county level for a handful of states, and it appears that this issue only affects rankings at the tract scale. When tract rankings are affected, the differences are very small. Certain tracts may move up or down by one position in their statewide rank, but I have observed no differences that I feel would be detrimental to an analysis using this data at the tract scale. Furthermore, I have not observed any differences between the CDC data and the calculated data in variable values which comprise the ranking variables.
The figures below show histograms of tract level comparisons of the SVI
scores calculated by svibuildr and the values in the datasets
downloaded from the CDC.Histograms for all 50 states are available
here.


References
[1] CDC-ATSDR, “CDC/ATSDR SVI 2020 documentation.” 2022. Available: https://www.atsdr.cdc.gov/placeandhealth/svi/documentation/SVI_documentation_2020.html
[2] K. Walker and M. Herman, Tidycensus: Load US census boundary and attribute data as ’tidyverse’ and ’sf’-ready data frames. 2022. Available: https://CRAN.R-project.org/package=tidycensus