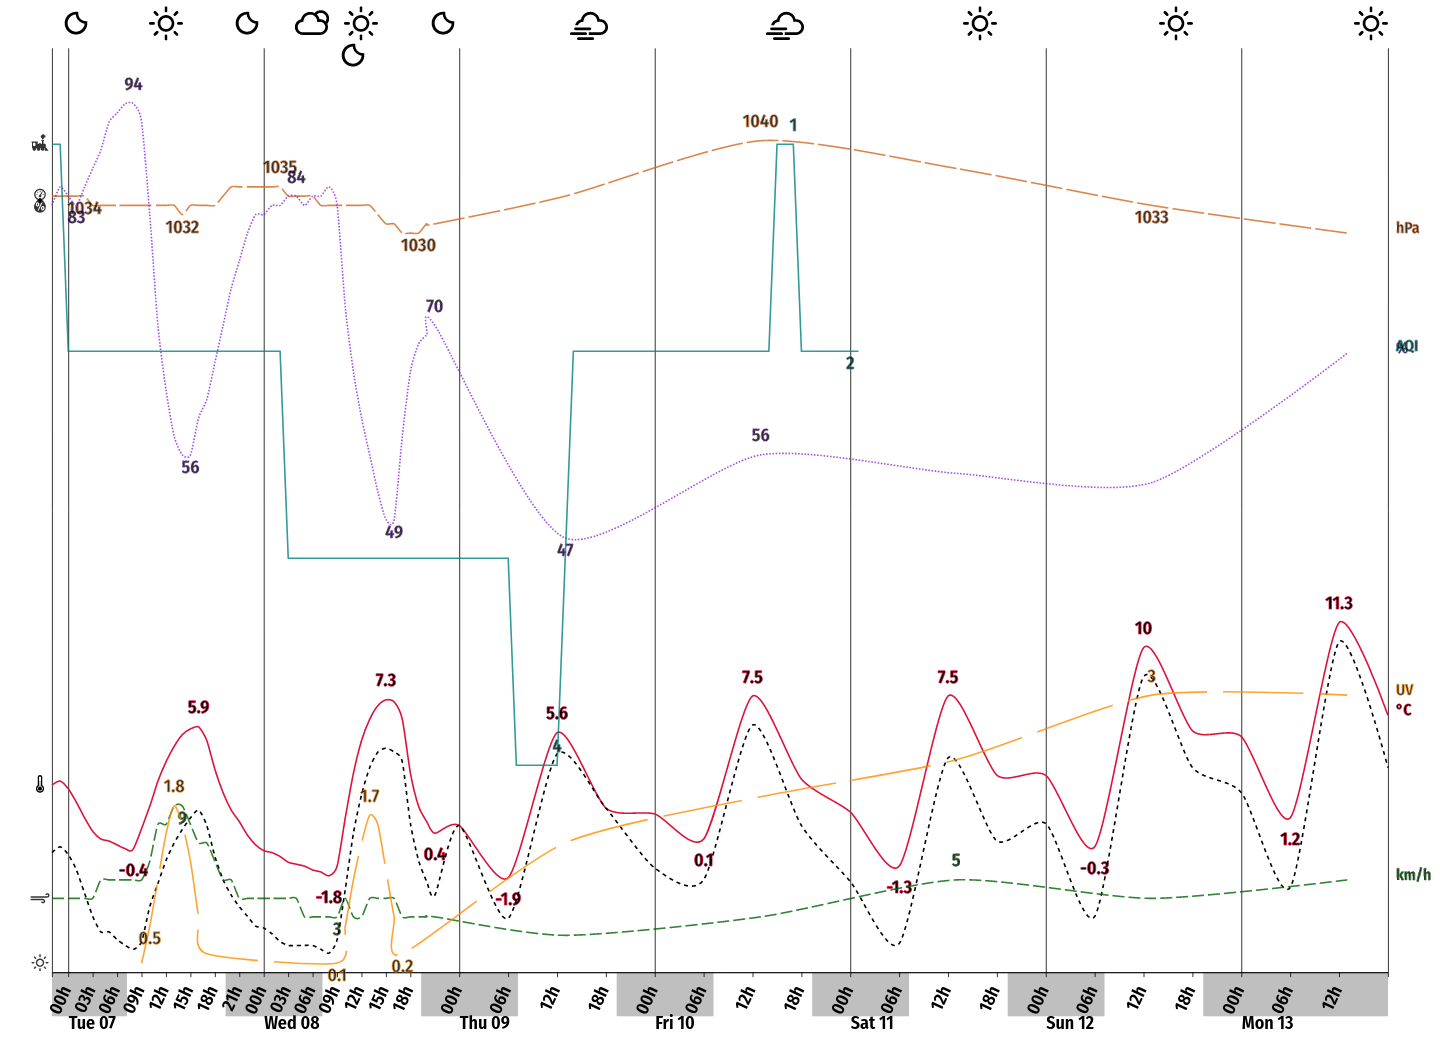
This is a module for the MagicMirror².
This module displays a weather chart using any weather provider. It can display temperature, feels like temperature, precipitation, snow and weather icons. It uses the D3.js library.
To use this module, add the following configuration block to the modules array in the config/config.js file:
var config = {
	modules: [
		{
			module: "MMM-WeatherChartD3",
			config: {
				updateInterval: 10 * 60 * 1000,
				initialLoadDelay: 0,
				weatherProvider: "openweathermap",
				weatherEndpoint: "/onecall",
				apiKey: "",
				type: "full", // Possible values: hourly, forecast (=daily) or specific value `full` which is a join of data from hourly+daily
				lang: config.language,
				lat: 0,
				lon: 0,
				units: config.units,
				locale: config.locale,
				d3jsVersion: "7", // can either be in format "7.4" or even "7.4.4"
				title: "Weather Forecast",
				height: 300,
				width: 500,
				iconSize: undefined, // in px or undefined to define automatically at first call
				iconURLBase: "https://raw.githubusercontent.com/erikflowers/weather-icons/master/svg/",
				hoursRatio: 0, // Ratio of fetched hours in graph (useful for openweathermap onecall that gives 48h with 1h precision) - 0 or undefined to ignore
				showIcons: true,
				showNights: true,
				showTemperature: true,
				showMinMaxTemperature: false,
				showFeelsLikeTemp: true,
				showPrecipitationAmount: true,
				showPrecipitationProbability: true, // Only used when showPrecipitationAmount == true
				showSnow: true, // if false: snow is included in precipitations
				showPressure: true,
				showHumidity: true,
				showWind: true,
				showAQI: true,
				showUVI: true,
			}
		},
	]
}cd ~/MagicMirror/modules # Change path to modules directory of your actual MagiMirror² installation
git clone https://github.com/seb-ma/MMM-WeatherChartD3
cd MMM-WeatherChartD3
npm install --no-audit --no-fund --no-update-notifier --only=prod --omit=dev| Option | Description |
|---|---|
updateInterval |
Optional How often does the content needs to be fetched? (Milliseconds) Type: int (milliseconds)Default 100000 milliseconds (10 minutes) |
initialLoadDelay |
Optional The initial delay before loading. If you have multiple modules that use the same API key, you might want to delay one of the requests. (Milliseconds) Type: int (milliseconds)Default 0 milliseconds |
weatherProvider |
Optional Which weather provider should be used. see https://github.com/MichMich/MagicMirror/tree/master/modules/default/weather/providers for list of available providers |
weatherEndpoint |
Optional The openweathermap API endPoint. Possible values: /onecall, /forecast (free users) or /forecast/daily (paying users or old apiKey only)Default value: /onecall |
type |
Optional Which type of weather data should be displayed. Possible values: hourly, daily or specific value full which is a join of data from hourly+dailyDefault value: full |
apiKey |
Required API key to fetch the weather provider |
lat |
Required Latitude of the location used for weather information. Type: float |
lon |
Required Longitude of the location used for weather information. Type: float |
lang |
Optional The language sent to provided. Default value: uses value of config.language |
units |
Optional What units to use. Specified by config.js Default value: uses value of config.units |
locale |
Optional The locale of the days. Default value: uses value of config.locale |
d3jsVersion |
Optional The D3 version to use. Default value: "7" Can either be in format "7.4" or even "7.4.4" |
height |
Optional Height of the chart area. Type: int (pixels)Default value: 300 |
width |
Optional Width of the chart area. Type: int (pixels)Default value: 500 |
iconSize |
Optional Size of weather icons. Auto-define the maximum possible size that fits in chart if undefinedType: int (pixels)Default value: undefined |
iconURLBase |
Optional Base of the URL to retrieve icons Default value: https://raw.githubusercontent.com/erikflowers/weather-icons/master/svg/ |
hoursRatio |
Optional Ratio of fetched hours in graph (useful for openweathermap onecall that gives 48h with 1h precision) - 0 or undefined to ignore Type: float (in [0 .. 1])Default value: 0 |
showIcons |
Optional Show weather icons Type: booleanDefault value: true |
showNights |
Optional Show a background color for nights Type: booleanDefault value: true |
showTemperature |
Optional Show a plot with temperature for each day Type: booleanDefault value: true |
showMinMaxTemperature |
Optional Show a plot with min and max temperature for each day (if given by provider) Type: booleanDefault value: false |
showFeelsLikeTemp |
Optional Show a plot with the "feels like" temperature (if given by provider) Type: booleanDefault value: true |
showPrecipitationAmount |
Optional Show a plot with precipitations (if given by provider). Type: booleanDefault value: true |
showPrecipitationProbability |
Optional Show precipitations probability (if given by provider). Only displayed when showPrecipitationAmount == trueType: booleanDefault value: true |
showSnow |
Optional Show a plot with snow (if given by provider). Include snow in precipitations plot if set to falseType: booleanDefault value: true |
showHumidity |
Optional Show a plot with humidity (if given by provider). Type: booleanDefault value: true |
showWind |
Optional Show a plot with wind speed (if given by provider). Type: booleanDefault value: true |
showAQI |
Optional Show Air Quality Index (if given by provider). Type: booleanDefault value: true |
showUVI |
Optional Show UVI (if given by provider). Type: booleanDefault value: true |
This chart can have a fully customized style.
Each item type have a specific class that can be overloaded in custom.css.

