R is a powerful statistic and graphics language and environment used by many individuals and organisations in their day-to-day work with data. In this short training, participants will learn about R, install a working version on their computer, get familiar with the language and environment and take it out for a simple test drive. By the end of this workshop, a participant should:
- Know what R and RStudio are (pun intended!)
- Have a working version of R and RStudio on their computers
- Be familiar with some features of RStudio
- Know some basic commands of the R language
- See the power of R packages and how to use them
- Know where to go for a deeper dive into R
-
Part 1
- About R
- Downloading & Setup
- Getting Familiar with RStudio
- Some Basic R Commands
-
Part 2
- Working Dataset: Ghana Health Facilities
- The Power of R Packages
- Building Your Data Pipeline
-
Part 3
- References
R is a powerful
-
Download R from CRAN website
-
Download RStudio IDE from RStudio website
-
Exercise 1: Setup RStudio on Your Computer
- Go to CRAN website, download your version of R and get it installed on your computer.
- Go to RStudio website, download your version of RStudio IDE and get it installed on your computer.
RStudio is a powerful Integrated Development Environment(IDE) that provides a convenient environment to run R-related tasks and projects easily. I will briefly review some of the keys features of RStudio but see this cheatsheet for more details.
-
Menus
-
Panes/Windows
- Source Editor
- Console
-
Help
-
Exercise 2:
- Create a new R Project
- Data Containers & Formats: vector, matrix, array, data frame, list, factors.
- Functions: str, length, dim, names, summary, ls, help/?, read.csv, table, View etc.
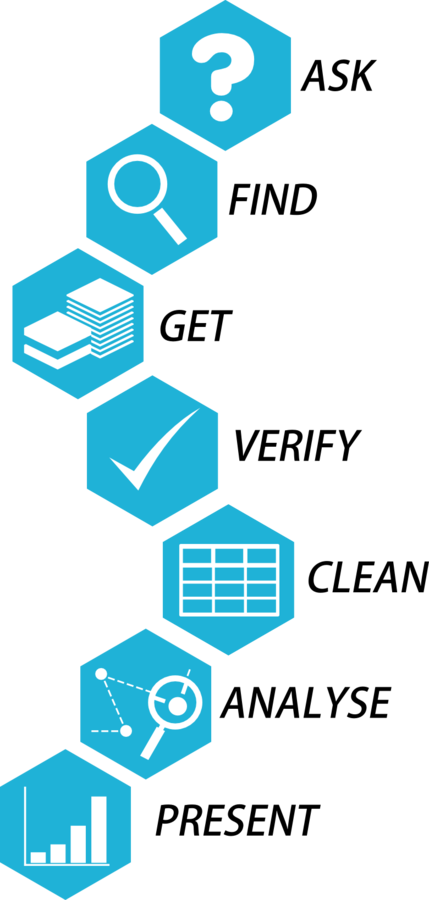
At School of Data, we like to think about the data analysis process as a pipeline. Below is a framework we usually use:
#### References & Resources - [RStudio Visualisation with ggplot2 cheatsheet](http://www.rstudio.com/wp-content/uploads/2015/12/ggplot2-cheatsheet-2.0.pdf) - [R Project](https://www.r-project.org/) - [Datacamp](https://www.datacamp.com/) - Hadley Wickham: follow on Twitter, @hadleywichkam - [R-bloggers](http://www.r-bloggers.com/) - [Flowing Data Website](www.flowingdata.com)

