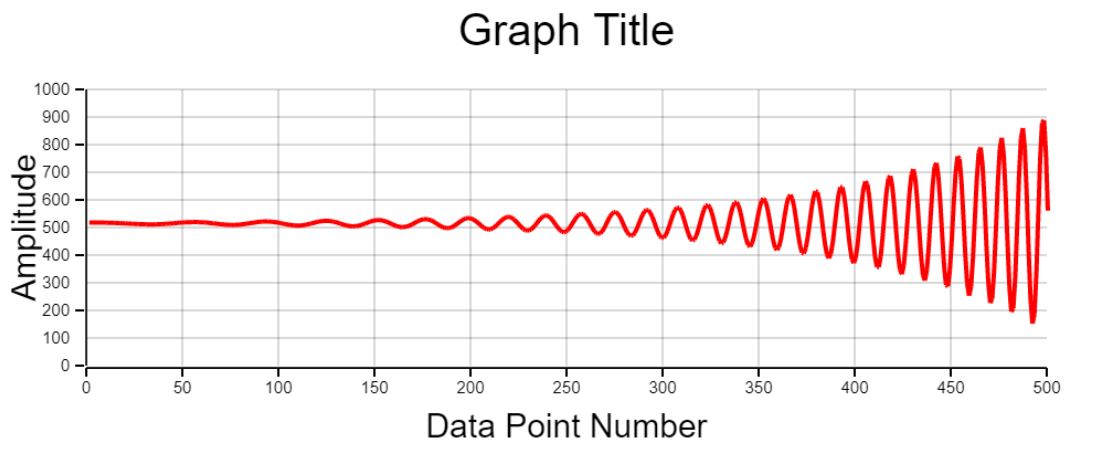
Graphy is a fast, JavaScript graphing library that was written as part of a Gravitational Wave exhibit at the Royal Society in 2017. The idea was to have a flexible, fast customisable way of displaying data from a Michaelson Interferometer on display. This only supports passing in of data to be displayed on the Y axis (we didn't need anything else), the x-axis will just be the data point number.
First initialise the library like so
graphy = new Plot();
graphy.initialisePlot();
Set some options (see below), get the input data and plot it like so,
graphy.plotData(graphData);An example file graph_test.html is included, containing data generation and sample plotting.
Many options can be changed, these are detailed below.
graphy.dataMax = 1000; //Max value for the data
graphy.dataMin = 0; // Minimum value for the data
graphy.dataLength = 500; // Length of dataCan be specified for, xAxis, yAxis, xGrid, yGrid and point.
graphy.lineColour.xAxis = "rgba(0,0,0,0.5)"; // Colour of the x axis
graphy.lineColour.yAxis = "rgba(0,0,0,0.5)"; // Colour of the y axis
graphy.lineColour.xGrid = "rgba(0,0,0,0.5)"; // Colour of the x grid
graphy.lineColour.yGrid = "rgba(0,0,0,0.5)"; // Colour of the y grid
graphy.lineColour.point = "rgba(0,0,0,0.5)"; // Colour of the graph pointsCan be specified for the xAxis, yAxis, xGrid, yGrid, xTick, yTick and point.
graphy.lineWidth.xAxis = 2; // Line width of X axis
graphy.lineWidth.yAxis = 2; // Line width of Y axis
graphy.lineWidth.xGrid = 2; // Line width of grid in X axis
graphy.lineWidth.yGrid = 2; // Line width of grid in Y axis
graphy.lineWidth.xTick = 2; // Line width of tick marks on x axis
graphy.lineWidth.yTick = 2; // Line width of tick marks on Y axis
graphy.lineWidth.point =2; // Line width of graph point Can be specified for xLabel, yLabel, title, xTick and yTick.
graphy.fontColour.xLabel = "rgba(0,0,0,1)"; // X label font colour
graphy.fontColour.yLabel = "rgba(0,0,0,1)"; // Y label font colour
graphy.fontColour.title = "rgba(0,0,0,1)"; // Title font colour
graphy.fontColour.xTick = "rgba(0,0,0,1)"; // X tick mark font colour
graphy.fontColour.yTick = "rgba(0,0,0,1)"; // Y tick mark font colourgraphy.fontSize.xLabel = 30; // X label font size
graphy.fontSize.yLabel = 30; // Y label font size
graphy.fontSize.title = 40; // Title font size
graphy.fontSize.xTick = 15; // X tick mark font size
graphy.fontSize.yTick = 15; // Y tick mark font sizeCan be any web-safe or installed font
graphy.fontType.xLabel ="Arial"; // Font of the X axis label
graphy.fontType.yLabel ="Arial"; // Font of the Y axis label
graphy.fontType.title ="Arial"; // Font of the graph title
graphy.fontType.xTick ="Arial"; // Font of the X axis tick labels
graphy.fontType.yTick ="Arial"; // Font of the Y axis tick labelsLabeling options, such as setting custom titles, labels, and positions can be done in the following way.
graphy.axisOption.xLabel ="Data Point Number"; // Title of X axis
graphy.axisOption.yLabel ="Amplitude"; // Title of Y axis
graphy.axisOption.title ="Graph Title"; // Graph Title
graphy.axisOption.xLabelAlign ="center"; // X axis title align, center, left, right
graphy.axisOption.YLabelAlign ="center"; // Y axis title align, center, left, right
graph.axisOption.titleAlign = "center"; // Graph title align, center, left, rightHere you can change whether to display grid lines, tick text labels, change the number of grid lines and change the tick lengths as follows.
graphy.plotOption.vertGridLines = true; // Displays vertical grid lines
graphy.plotOption.horGridLines = true; // Displays horizontal grid lines
graphy.plotOption.drawxTickText =true; // Draws X Tick Text
graphy.plotOption.drawyTickText = true; // Draws Y Tick Text
graphy.plotOption.numVertGridLines = 10; // Number of vertical grid lines
graphy.plotOption.numHorGridLines = 10; // Number of horizontal grid lines
graphy.plotOption.xTickLength = 10; // Length of X tick lengths
graphy.plotOption.yTickLength = 10; // Length of Y tick lengths