Supplementary Material for ESEC/FSE 2018 paper "Towards a Theory of Software Development Expertise"
This dataset enables researchers to replicate the quantitative results from our paper and to trace the qualitative results from the high-level concepts and categories described in the paper to participants' responses. Moreover, it provides additional figures and data that are supplemental to the results described in the paper.
Documentation
In the directory doc, you will find the questionnaires and codebooks used for sample S1 (phase 2) and samples S2 and S3 (phase 3). Moreover, we provide our research questions for phases 1 and 2.
Demographics
To create the file results/demographics.csv, which corresponds to Table 1 in the paper, please execute the R script src/demographics.R. This R script also creates two figures that didn't make it into the paper (results/boxplots_experience_expertise.pdf and results/likert_expertise.pdf) and contains analyses of demographic variables that we described in Sections 3.1 and 5.2 (gender, main role, continent).
Closed-ended questions
In Section 5.3 of the paper, we describe results from closed-ended questions asking about the concepts monitoring, mentoring, and performance decline. You will find the corresponding analyses in the R script src/closed_ended_questions.R.
Experience and Expertise
The correlation table mentioned in Section 6.1 can be found in the directory doc:
The R script src/correlations.R creates three CSV files for each sample:
results/correlations_sample{1|2|3}_coefficients.csvcontaining the calculated correlation coefficients.results/correlations_sample{1|2|3}_p-values.csvcontaining the corresponding p-values.results/correlations_sample{1|2|3}_n.csvcontaining the number of observations considered for the calculation of the correlations.
To replicate the analysis described in Section 6.2, please open the R script src/self-assessments.R. You will find the reported statistics in this file. Moreover, you can create the figure results/boxplots_dreyfus.pdf that visualizes the results (but didn't make it into the paper).
Coding Schema
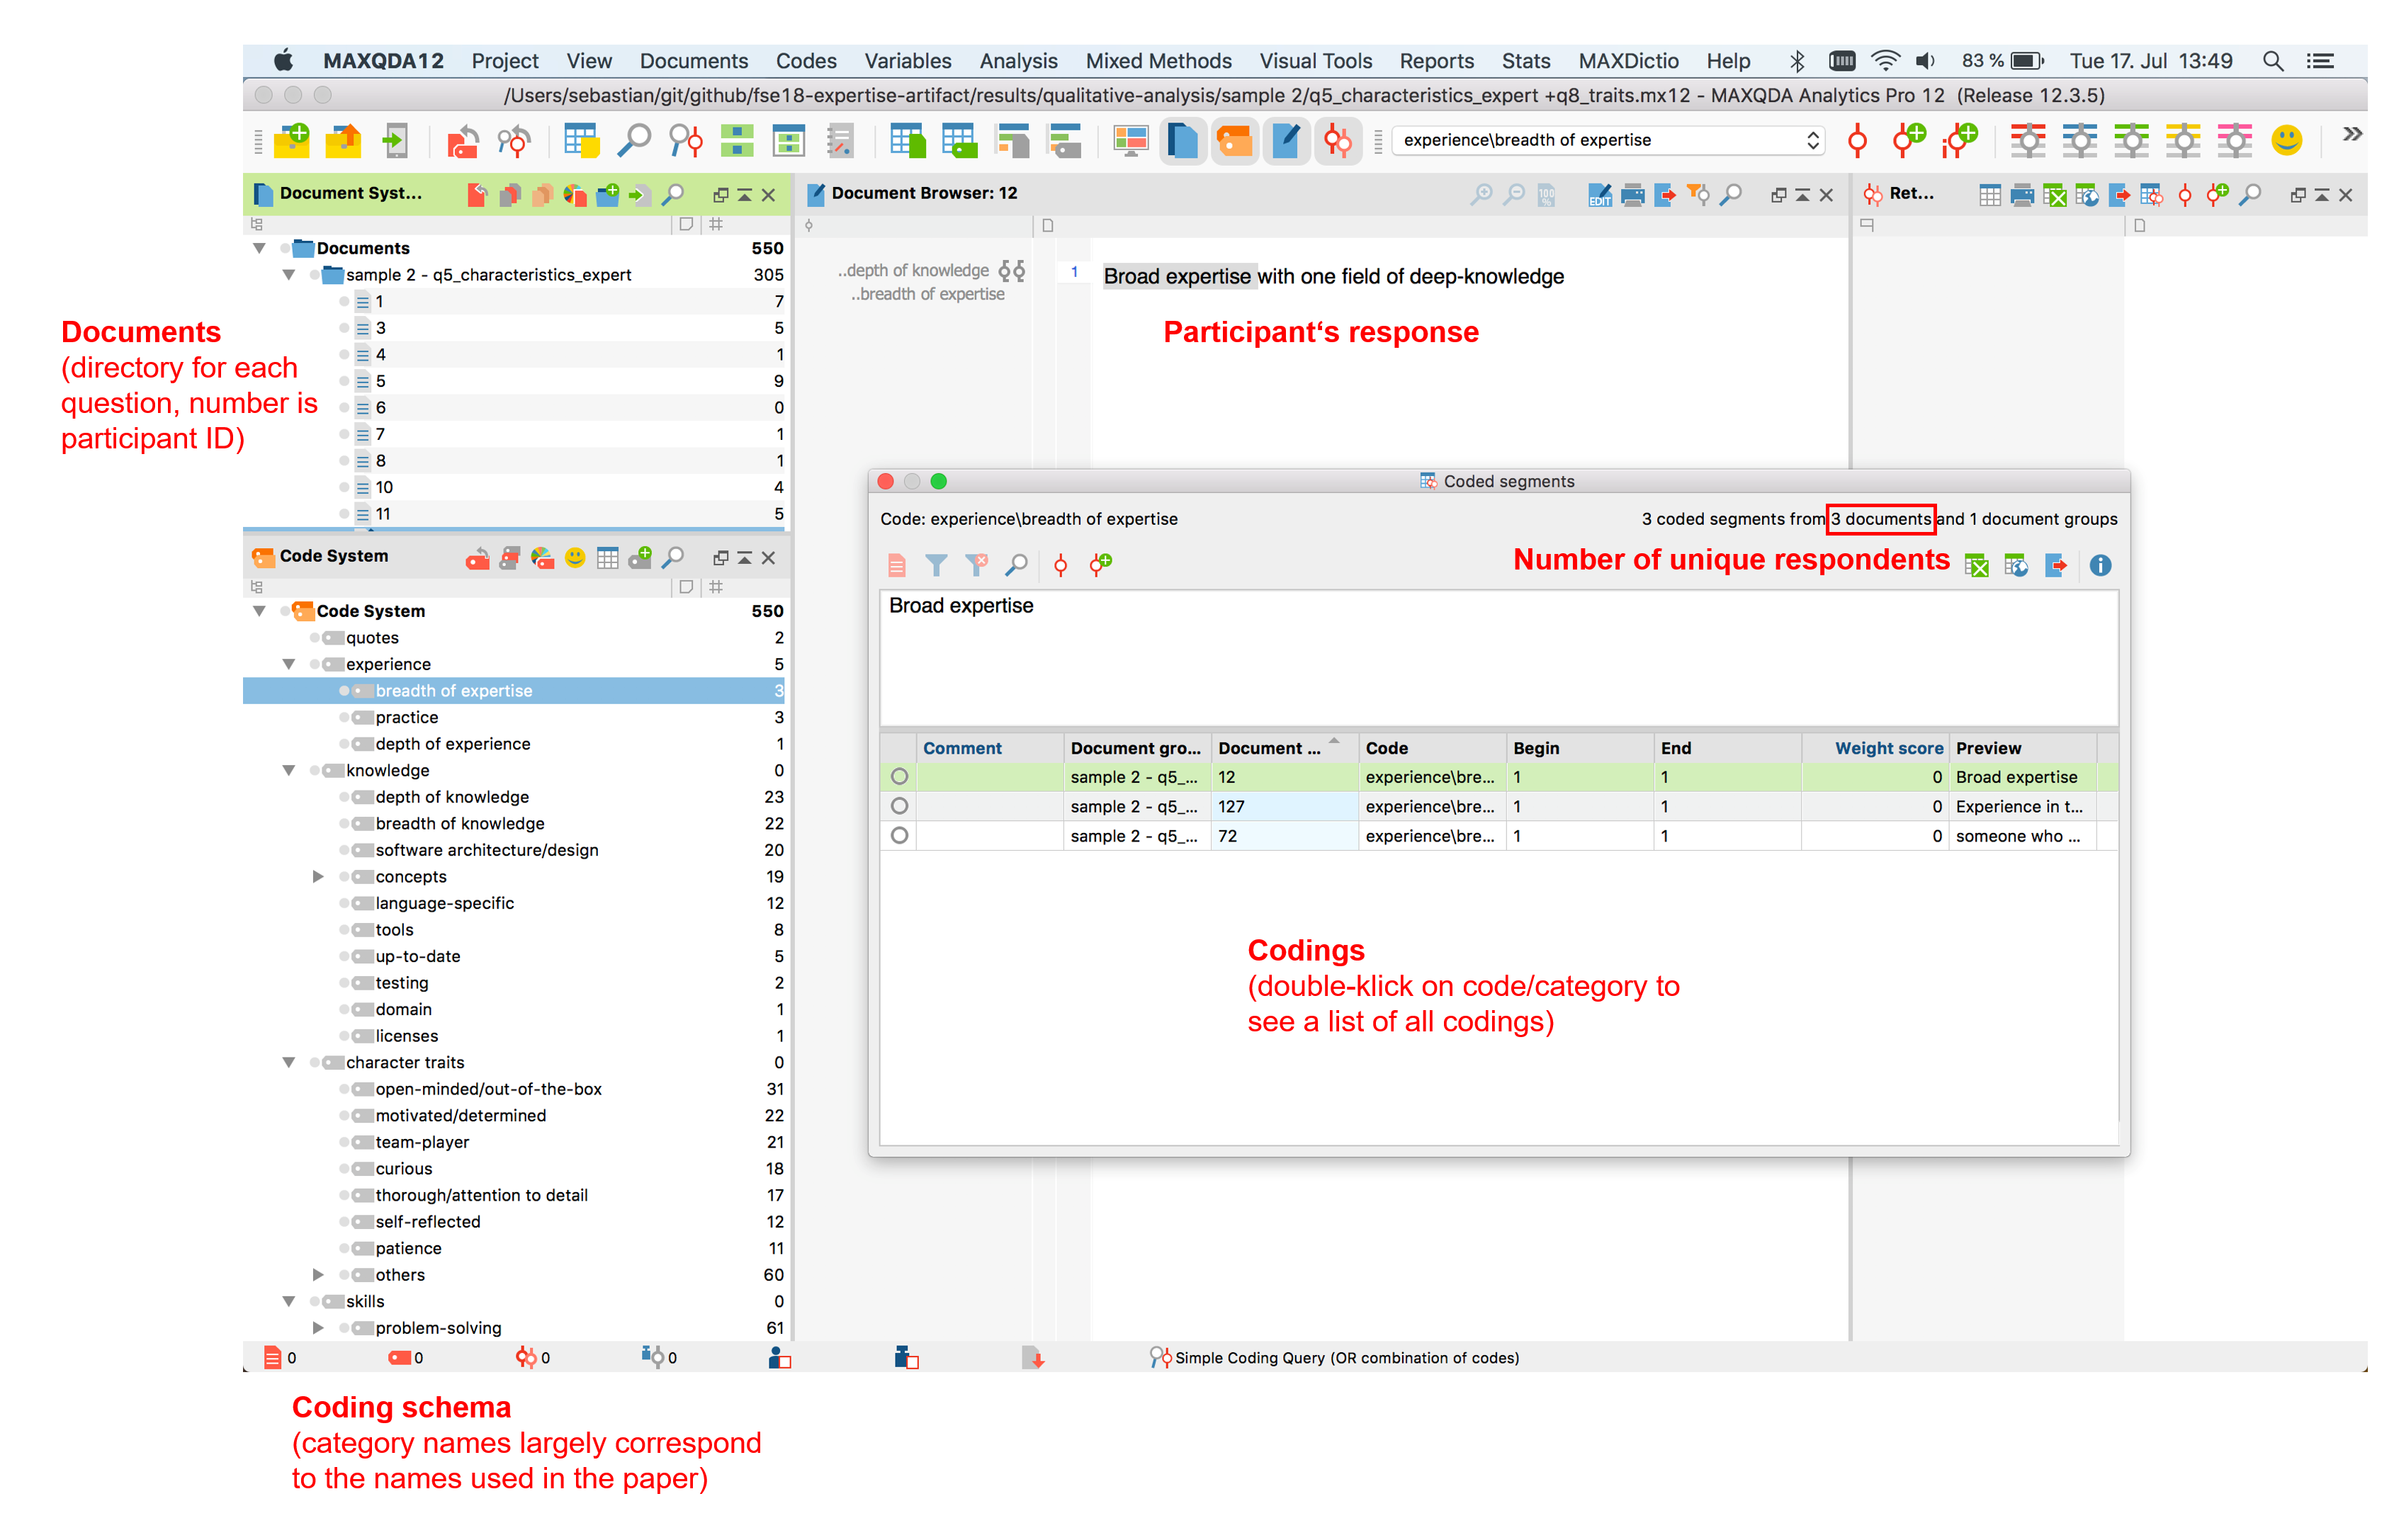
The trace to concepts and categories described in Sections 3 to 5, please open the MAXQDA files provided in the directory results/qualitative-analysis/sample{1|2|3}.
In directory doc, we also provide a brief description of MAXQDA's GUI:
Anonymity
We removed all user names, email addresses, websites, and company names that could identify individual participants. If you observe any information that could identify participants, please immediately inform us (research@sbaltes.com).
Code frequencies
Please note that the frequencies displayed in MAXQDA may differ from the number of answers we provided in the paper (usually in brackets). The reason for this is that MAXQDA counts the number of codes, but we counted the number of distinct respondents; there may be multiple codes per answer. You can see the number of distinct respondents in the "Coded segments" view (see above). Please note that in some cases, we added up the answers from multiple samples (S2 and S3).
Citation
This dataset is available on Zenodo:
Please cite it as:
Towards a Theory of Software Development Expertise — Supplementary Material.
Sebastian Baltes and Stephan Diehl.
http://doi.org/10.5281/zenodo.1299798
License
The dataset is licensed under the Creative Commons Attribution 4.0 International License.

