ledger-explorer
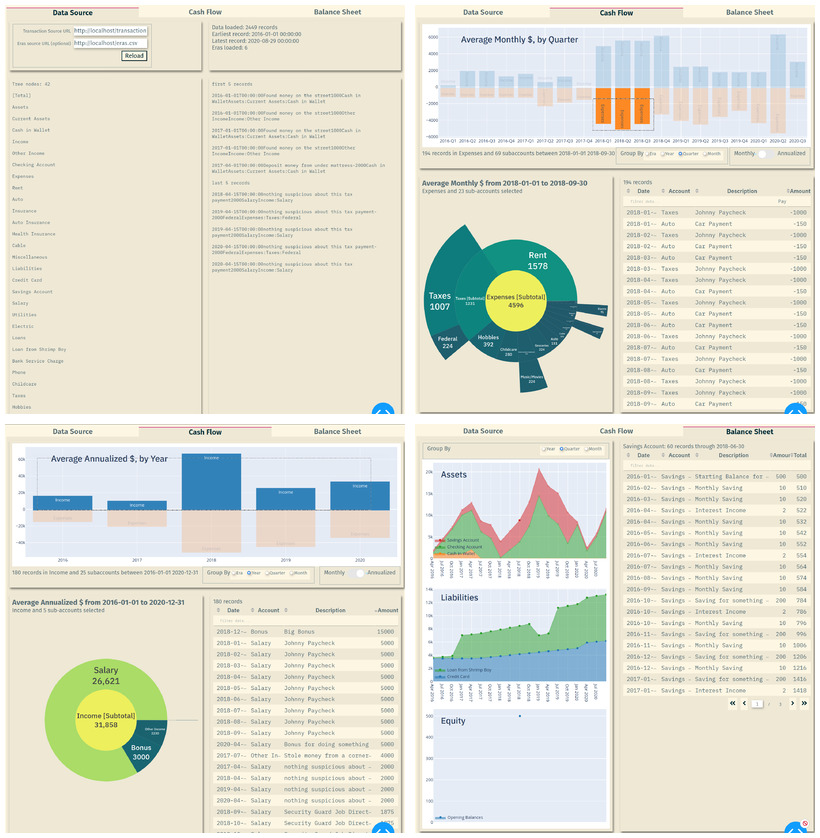
Navigate a hierarchical ledger graphically, all the way down to individual transactions. This tool's purpose is enabling quick navigation through a graphical view of aggregate data in a pie chart or bar chart, representing tens of thousands of records, to a list of specific transactions. This seems like a really obvious feature but has been surprisingly (in my limited experience) rare in off-the-shelf F/OSS interactive visualization tools. The Plotly Dashboard works very well for this purpose.
Installation
See docs/INSTALL.md
Usage
See docs/USAGE.md
Known Bugs
Yes, many. In particular:
- Navigating to Settings tab auto-loads new defaults, which it oughtn't, since this means defaults are coded in two places.
- If you then navigate back to Data Source tab, these defaults will break the default load.
- If you edit the settings before navigating back to Data Source, Data Source will apply the new settings. But navigating back to Settings will erase your inputs, resetting them to the defaults (which, again, are different from the defaults you get if you never navigate to Settings tab)
- If you then navigate back to Data Source tab, these defaults will break the default load.
- If no era file is present, clicking the Era selector will cause an error.
Roadmap
- Complete unit testing (currently 1% coverage)
- Verify running in gunicorn - DONE
- Publish somewhere as a free service - DONE
- Implement night mode using Dash's native commands
- Add ability to import at least 1 public data set, maybe national budget?
- Add ability to save and load settings, including data sources.
- Improve the UI of Data Source to make it easy to test column name settings and see results.
- Improve navigation and charting tools
Contributing
Yes, please. Questions, requests, better documentation, and patches welcome.