Module Progress is a Python script and Tableau workbook for visualizing students progress in a Canvas course. The script component gathers, cleans and exports data from the Canvas LMS REST API. This data can then be imported into Tableau and explored using a collection of interactive dashboards.
This tool is meant to enhance the data available from Canvas's module progress data but where you can only see one student at a time.:
You can take a look at our Demo Dashboard
-
Create a file called
.envin the ROOT folder with the following fields:CANVAS_API_TOKEN = # paste your personal token here -
install environment using Conda
$ conda env create -f environment.yml$ conda activate module-progress
The script will need to know which courses to query. Rename the file SAMPLE_course_entitlements.csv, to course_entitlements.csv ensure there is a course_id column and list all target course id's in that column (Note you'll need to have the proper Canvas privledges to get the data).
You can add a optional user_id column as well if working with Tableau Server. Here, you can list Tableau Server user id's to make certain course data be visible to certain users.
If you are not planning to use user filtering, you may delete the entire user_id column
For example:
| course_id | user_id |
|---|---|
| 12345 | foo |
| 54321 | foo |
| 54321 | bar |
| 67890 | bar |
In the above example user foo will be able to see course 12345 and user bar will be able to see course 67890. Both will be able to see course 54321. Note that the same course id listed multiple times will not duplicate data.
Read more about Tableau user filters here
- Open terminal and navigate to project ROOT directory
- Start the Conda environment:
conda activate module-progress - Run the script:
python update_module_progress.py - Wait for script to finish and print table to console. Evaluate the printed output and ensure necessary courses have completed successfully. If a course fails, error messages will provide info about what went wrong.
- All courses that completed successfully will have a directory titled by course id in the /data folder with 4 CSV files inside
- The directory:
data/Tableauwill contain all the necessary files for linking to Tableau including:- module_data.csv: A table containing a union of data for all successfully queried courses
- status.csv: A table that reflect the status of the most recent run. For each course shows the state of the query (Success or Failed), date and time of last run and any error/success messages.
- Note: the script will delete any existing course folders and only archives the "tableau" data. Please be aware of this before running.
When you first open module-progress.twb you should use the sample data provided in the /SAMPLE_Tableau_Data directory. Follow the instructions under the Without User Filters section to import the data. Ensure that all the dashboards show sample data before applying custom data. We recommend getting familiar with the different views with the smaller sample dataset before jumping into larger dataset.
To work with non-sample data (output from script), open module-progress.twb and navigate to Data Source tab
- Create a connection with one of the CSV files in the
data/Tableaudirectory. - Create a connection with
course_entitlements.csv - Define relationship between tables on Course ID as such:
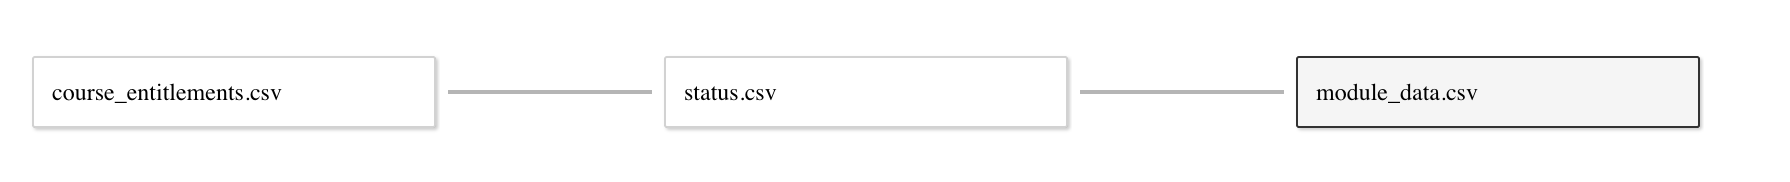
- Sign in to Tableau Server to enable filtering to your specifications in
course_entitlements.csv - Go to any sheet within the dashboards and apply the calculated field "User Filter" in "Filters" (select only those that are "True") - apply this filter to all sheets using the dataset when prompted
Note this calculated field matches your Tableau username to the "User Id's" specified in
course_entitlements.csvand will filter out any courses that aren't associated with that username.

- Connect the
module_data.csvandstatus.csvdata sources to Tableau and define their relationship as such: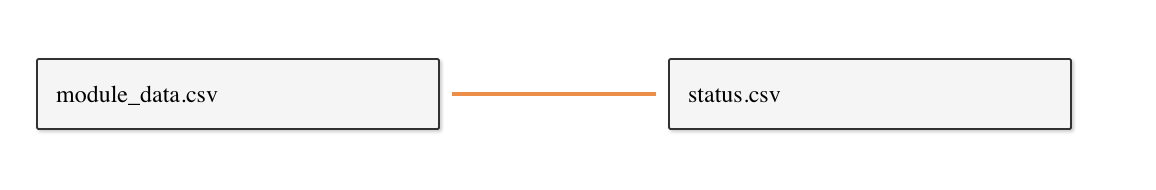
- The two tables should be linked via Course ID

When the data sources has been connected. The Overall Status dashboard provides a dropdown where courses can be selected for the visualization by Course Name (only one course can be selected at a time)
/src: Python files with all the logic for gathering data from Canvas and outputting CSV tables to /data.
/data: Holds the data outputted by the script. Output data will be organized into folders titled after the Canvas course id. Tables will be located in this directory in CSV files.
/data/Tableau: contains status.csv and module_data.csv which detail run status and course data respectively. These three CSV's get imported into Tableau.
/status_log: Folder containing CSV log files (one per run). Log files will show the status (success or failed) of fetching data for each course specified in course_entitlements.csv.
archive: At the beginning of each run, the contents of /data get zipped and stored in this folder.
.env: Created manually. Where user sets their Canvas API Token.
module_progress.twbx: Tableau workbook containing dashboards to visualize the data output. This packaged workbook also includes mock data.
course_entitlements.csv: Where courses are specified (by Canvas course id). Must list course ids under a column titled "course_id". Optional "user_id" column if using Tableau Server & User Filters.
environment.yml: Conda environment file.
- Marko Prodanovic
- Jeremy H
- Ranjit Sundaramurthi for his work developing a web version of the dashboard