A/B Tests are very commonly performed by data analysts and data scientists. It is important to get some practice working with the difficulties of these.
This is the fourth project of Data Analyst Nanodegree at [Udacity]. For this project, we will be working to understand the results of an A/B test run by an e-commerce website (fictional).
My goal is to determine whether they should implement this new page, keep the old page, or perhaps run the experiment longer to make their decision.
| Event | Probability |
|---|---|
| Conversion of an individual regardless of the page he receives | 0.1196 |
| Conversion of an individual given he was in the control group | 0.1024 |
| Conversion of an individual given he was in the treatment group | 0.1188 |
| Individual received the new page | 0.5 |
Not much change in the conversion based on the layout of the homepage. Instead, the conversion rate falls down from 0.1196 on old page to 0.1188 on new page.
Notice that because of the time stamp associated with each event, we could technically run a hypothesis test continuously as each observation was observed.
However, then the hard question is do we stop as soon as one page is considered significantly better than another or does it need to happen consistently for a certain amount of time? How long do we run to render a decision that neither page is better than another?
These questions are the difficult parts associated with A/B tests in general.
For now, we are making decision just based on all the data provided. We will assume that the old page is better unless the new page proves to be definitely better at a Type I error rate of 5%.
Accordingly, our null and alternative hypothesis are:
Null Hypothesis (H0): pnew = pold
Alternative Hypothesis (H1): pnew > pold
where, pold and pnew are conversion rates for old and new pages.
p-value for our alternative hypothesis is 0.09. It shows that we fail to reject our null hyptothesis in favor of the alternative.
Since each row is either a conversion or no conversion, we perform logistic regression in this case.
The goal is to use statsmodels to fit the regression model to see if there is a significant difference in conversion based on which page a customer receives.
Here is a summary of the model:
The dependent variable is converted column which is 1 if the user is converted and 0 if not.
Independent variable is ab_page column which is 1 for treatment and 0 for control.
The p-value associated with ab_page is 0.190. It is different from the p-value calculated in Part II because our null and alternative are differnt now. In Part II we were calculating p-value for a one-sided alternative and here we are calculating for a two-side alternative.
Currently, we have only one predictor variable. We obtained an aggregate result based on just the page the user receives. There maybe other factors affecting conversion on a lower level than we are analysing right now. Maybe if we had other features then we could decide better about which page drives more conversion.
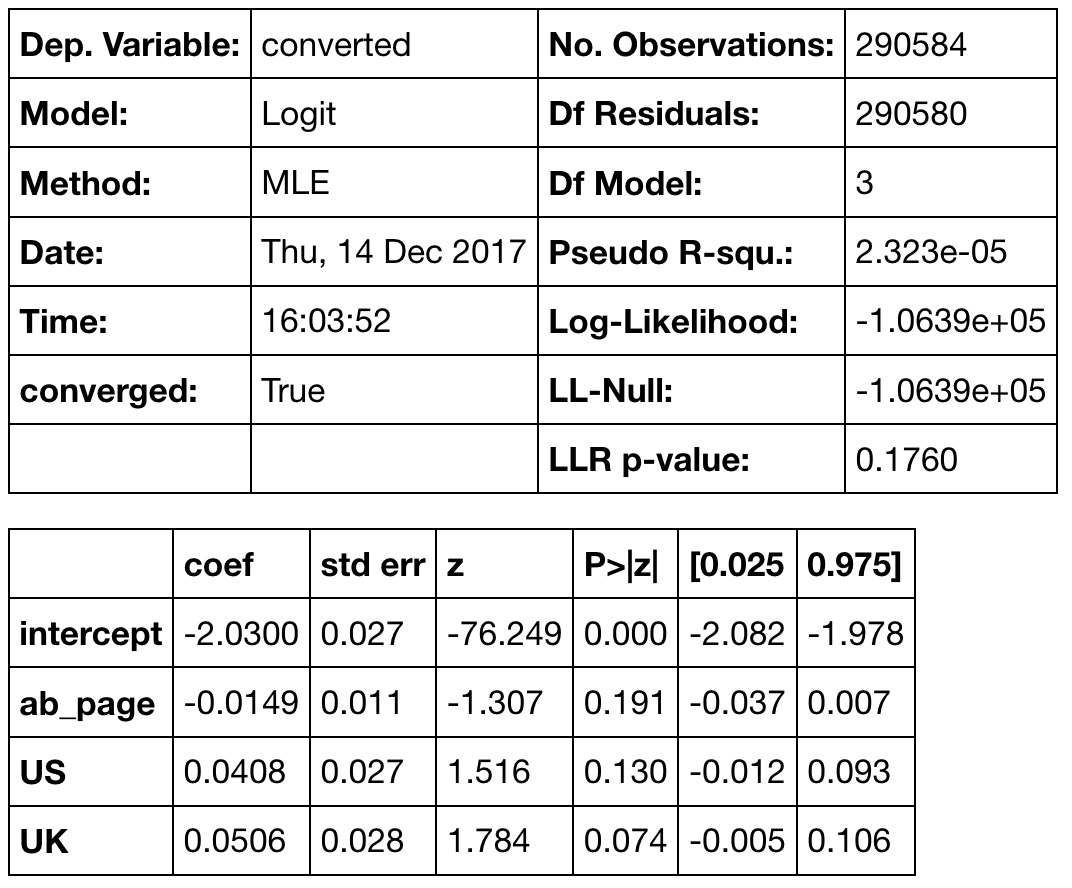
Now along with testing if the conversion rate changes for different pages, we also add an effect based on which country a user lives. Countries data is in countries.csv.
Here is a summary of the model after considering the location information:
Earlier we chose our alternative hypothesis that the new page drives more conversion. Then our evaluation of p-value suggested that we cannot reject the null hypothesis.
We then used built-in z-test to see the statistical significance. The p-value from z-test also suggested that there is not much evidence to reject the null.
Regression models also showed the same results that we cannot reject the null hypothesis. p-values from regression model were also not below 5% Type I error rate. Maybe if they run their test for longer time or we have large data compared to this, then the results could be different. But as of now, new page does not increase the conversion rate. In our dataset we had some misalignments in rows that further reduced the area of research.
- analyse_ab_test_results_notebook.ipynb:
This is the file where I performed the main work of this project including data wrangling and hypothesis testing.
- ab_data.csv
Input dataset with five features:
- user_id
This is the unique identifier for this data set.
-
timestamp
-
group
Can have two values: control or treatment. Control means the old user group who are visting sites since a very long time. They generally see the old landing page. Treatment means the new user group who see the new landing page.
- landing_page
It also has two values: old_page & new_page. New page is the one which we think may improve web traffic on website.
- converted
It can be 0 or 1. 1 means the user converted and 0 means the user did not convert.
- countries.csv
Dataset to include the countries column as another independent variable.
- report.html
HTML export of Jupyter Notebook.

