


- Project Description
- Data Source
- Key Insights
- Data Cleaning
-
Data Analysis And Visualization
- 5.1 Distribution of respondents based on country
- 5.2 Impact of participation rate due to different ethnicity
- 5.3 Most popular programming language in three years
- 5.4 Distribution of developers based on their developer role
- 5.5 Distribution of respondents based on age
- 5.6 Salary distribution of top ten countries
- 5.7 Analysis of impact of education on salary
- 5.8 Gender distribution among top five countries in 2019
- 5.9 Where most data scientist came from in 2019?
- 5.10 Countries which pays the most for data scientist in 2019
- Machine Learning
- Conclusion
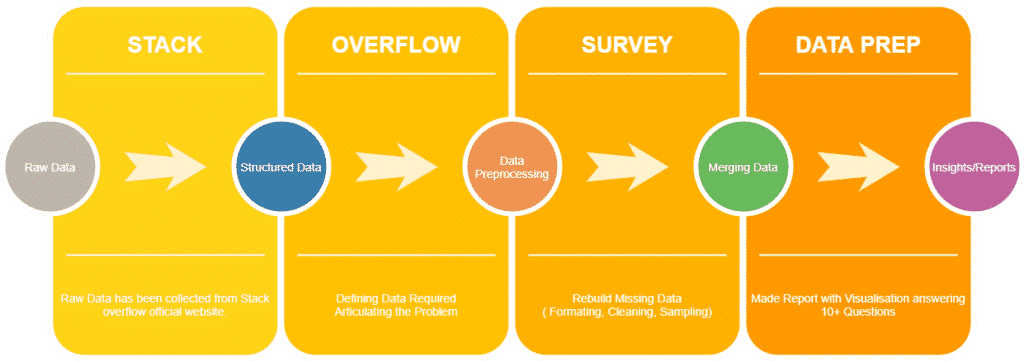
Stack overflow is a professional community for developers. They conduct developer surveys every year since 2011, and the collected data is available open-source on the web. The latest dataset 2020 was released on March 5th, 2021. With proper analysis, the Dataset would help us to answer real-world questions. For instance, we can find the most popular language that the developers use.We also can find the developer role which pays the highest salary. Our project is to analyze the last three years of the developer survey and gather meaningful insights from it.
As a first step, we will clean the data by removing null values and outliers in each column. Then, refactor the columns in such a way that help us in analysis. Then we performed data analysis and machine learning on the cleaned dataset. We used machine learning to understand the growth of languages and the salary for data scientists in the upcoming years.
The questions that we answered as part of the analysis were given in the Data analysis and visualization section. Please refer to the Jupyter notebook file for all the codes. This readme.md file explains the key steps and results that we got as part of our project.
- Project Presentation Sides -> https://www.canva.com/design/DAEdO-AUjRY/beEs8h-x6erz4d8s_XXsbw/view
The dataset is very diverse and came from a Stack overflow developer survey from 180 countries. Stack overflow has data collected through surveys from 2011 to 2020. We choose 2018,2019 and 2020 to analyze for the projects. The participants mostly from the US, India, and EMEA regions. The majority of the survey respondents had a background of developer/ coding experience. We performed various analysis and our key results are given in the Data Analysis section.
Dataset can be downloaded from the mentioned below link:
Download Link -> https://insights.stackoverflow.com/survey
Available in GitHub community Exchange ->https://education.github.com/globalcampus/exchange?utf8=%E2%9C%93&q=sanjay
The data are available in the CSV format ranging from 40 to 150 MB with data of 1.5 Lakh survey participants. The attributes are 130,86 and 62 respectively for the years of 2018,2019 and 2020. For our project, we focused on specific features. As a result, we specifically chose columns which required for our analysis and dropped the ones which were not required.
The reason why we chose this dataset is because of its diverse nature and it was completely uncleaned. We, as a developer, use Stack overflow to find answers for most of the questions we get. That encouraged us to explore and derive key insights from the survey results. Also, the Insights can be used for a better understanding of the information technology and hiring employees and job seekers for preparing the career resume building.
- JavaScript has maintained its stronghold as the most commonly used programming language. Almost 70% of the respondents are using Javascript. HTML/CSS stands as the second most popular language with about 63%
- About
55%of respondents identify themselves as full-stack developers, and about20%consider themselves as mobile developers. - Most of the respondents were from the United States. For example, in the year 2020, USA had about
20%respondents and the second highest was india with about14%respondents. We have plotted geographical plot usingplotlyto map how many respondents were from each country. - Consistent with the data from all three year, we still see evidence that people of color are underrepresented among professional developers. About
63%of the respondents were ofWhite or european descend - Women developers account for almost
11%of developers in the US. Followed by Canada having9.6%. In countries such as Germany, India, and Poland, the participation rate is about half of that, which goes to show there is still much work to do to reach appropriate gender representation in the field. - Approximately 75% of respondents worldwide completed at least the equivalent of a bachelor's degree or higher. The average salary of respondents holding bachelors degree is $123,299. Respondents who has done Doctorate degree holds the highest mean salary of about $173,000.
- About
70%of the developers are under 35 years of age. Only 5% of the respondents were about 50 years of age. - Most of the Data scientist respondents came from United States(1550). And the country which has the second highest number of data scientist is India(540)
- The country which pays the highest salary for Data scientist is Ireland($275,851). The second highest was Luxembourg($272,796). Australia pays about ($146,803)
As our first step, we started gathering information on all three datasets and looked into the columns that answer the questions we have as part of our research. The mentioned below columns were choosen as key factors for our analysis
['Age','ConvertedComp','Country','Currency','DevType','Employment',
'RaceEthnicity','Gender','SalaryType','Hobby','JobSatisfaction','JobSearchStatus',
'OperatingSystem','UndergradMajor','YearsCoding','YearsCodingProf',
'LanguageDesireNextYear','LanguageWorkedWith','FormalEducation']
Some of the column names were not easily understandable, for example, the column ConvertedComp stands for the annual salary of the respondents in USD. We changed the name of column to SalaryUSD for easier understanding. Similarly, name of below mentioned columns were changed
| Before renaming | After renaming |
|---|---|
| MainBranch | Profession |
| CareerSat | JobSatisfaction |
| ImpSyn | CompetenceLevel |
| JobSat | CurrentJobSatis |
| JobSeek | JobStatus |
Most of the column values were more detailed and were difficult for analze. For instance, the values in the EdLevel column were as below.
Computer science, computer engineering, or software engineering')
Another engineering discipline (ex. civil, electrical, mechanical)'),
Information systems, information technology, or system administration'),
Mathematics or statistics'),
I never declared a major'),
A natural science (ex. biology, chemistry, physics)')
A health science (ex. nursing, pharmacy, radiology)'),
Web development or web design'),
A business discipline (ex. accounting, finance, marketing)'),
A humanities discipline (ex. literature, history, philosophy)')
A social science (ex. anthropology, psychology, political science)')
Fine arts or performing arts (ex. graphic design, music, studio art)')
We refactored the column values with simple values that explains respondent's education level.
def refactor_ed(df):
    '''function to change Education level category to Bachelors, Masters, Professional, Associate, Doctorate, No Degree'''
    conditions_ed = [(df['EdLevel'] == 'Bachelor’s degree (BA, BS, B.Eng., etc.)'),
                     (df['EdLevel'] == 'Master’s degree (MA, MS, M.Eng., MBA, etc.)'),
                     (df['EdLevel'] == 'Professional degree (JD, MD, etc.)'),
                     (df['EdLevel'] == 'Associate degree'),
                     (df['EdLevel'] == 'Other doctoral degree (Ph.D, Ed.D., etc.)'),
                     (df['EdLevel'] == 'Some college/university study without earning a degree')
                     | (df['EdLevel'] == 'Secondary school (e.g. American high school, German Realschule or Gymnasium, etc.)')
                     | (df['EdLevel'] == 'Primary/elementary school')
                     | (df['EdLevel'] == 'I never completed any formal education')]

    choices_ed = ['Bachelors', 'Masters', 'Professional', 'Associate', 'Doctorate', 'No Degree']

    df['EdLevel'] = np.select(conditions_ed, choices_ed, default = np.NaN)

    return df

# applying function to subsets
survey_df_2019 = refactor_ed(survey_df_2019)
survey_df_2019['EdLevel'].replace('nan', 'Bachelors', inplace=True)
By doing so,we reduced our column values to the simplest form.
Bachelors       36494
No Degree       18542
Masters         17305
Associate        2585
Doctorate        2032
Professional     1037
Similary, we followed the same for other columns such as Gender Profession UndergradMajor JobStatus Employment
One of our column Ethnicity had 173 values and had various subcategories. Some of the values are given below for reference.
'White or of European descent',
 'White or of European descent;Multiracial',
 'East Asian',
 'Black or of African descent;East Asian;Hispanic or Latino/Latina;Middle Eastern;Native American, Pacific Islander, or Indigenous Australian;South Asian;White or of European descent;Biracial;Multiracial',
 'Black or of African descent',
 'Hispanic or Latino/Latina;Multiracial',
 'Hispanic or Latino/Latina',
 'Middle Eastern',
 'South Asian',
 'Multiracial',
 'East Asian;South Asian',
 'Biracial',
 'Native American, Pacific Islander, or Indigenous Australian;White or of European descent',
 'Black or of African descent;White or of European descent;Biracial',
 'Middle Eastern;White or of European descent',
 ......
We categorized them into the categories which are given below
| White or of European descent | 26848 |
|---|---|
| South Asian | 3783 |
| Hispanic or Latino | 3072 |
| Middle Eastern | 1840 |
| East Asian | 1661 |
| Black or of African descent | 1633 |
| Southeast Asian | 1371 |
| Multiracial | 249 |
| Biracial | 138 |
| Indigenous | 63 |
The codes we wrote to categorize are given below.
#combine Ethnicity by str.match(if each string starts with a match of a regular expression pattern)
df2020.loc[df['Ethnicity'].str.match('Biracial') == True, 'Ethnicity'] = 'Biracial'
df2020.loc[df['Ethnicity'].str.match('Black or of African descent') == True, 'Ethnicity'] = 'Black or of African descent'
df2020.loc[df['Ethnicity'].str.match('East Asian') == True, 'Ethnicity'] = 'East Asian'
df2020.loc[df['Ethnicity'].str.match('Hispanic or Latino') == True, 'Ethnicity'] = 'Hispanic or Latino'
df2020.loc[df['Ethnicity'].str.match('Indigenous') == True, 'Ethnicity'] = 'Indigenous'
df2020.loc[df['Ethnicity'].str.match('Middle Eastern') == True, 'Ethnicity'] = 'Middle Eastern'
df2020.loc[df['Ethnicity'].str.match('South Asian') == True, 'Ethnicity'] = 'South Asian'
df2020.loc[df['Ethnicity'].str.match('White or of European descent') == True, 'Ethnicity'] = 'White or of European descent'
df2020.loc[df['Ethnicity'].str.match('Multiracial') == True, 'Ethnicity'] = 'Multiracial'
The above process has been carried out for all three data frames 2018 2019 2020

As with any large data sources, we had a lot of null values that had to be handled. For instance, the 2020 dataset had 371,506 missing values(cells) in total. Overview of how we handled null values for a few of the columns are given below. Please check out jupyter notebook for how we handled null values in all other columns in all three dataset 2018 2019 2020
The "Age" column had 19,015 missing values in the 2020 data frame. We filled the null values with the mean value of each gender.
#fill Age's null values with mean of each gender
means = df2020.groupby('Gender')['Age'].transform('mean')
df2020['Age'] = df2020['Age'].fillna(means)

#convert from float to int
df2020['Age'] = df2020['Age'].apply(str).str[:2]
df2020['Age'] = df2020['Age'].apply(int)
outliers -> removed the respondents whose ages are more than 60 years and less than 15 years.
#Cleaning Age's outliers from each gender)
df2020 = df2020[(df['Age'] >= 15) & (df2020['Age'] <= 60)]
For some of the columns, we made use of bill() and fill() method to fill the null values and made sure that filling the values this way dose not change the order of values. Let us take an example of the DevType column.
| DevType | Before filling null | After bill() & fill() |
|---|---|---|
| full-stack | 3399 | 3940 |
| back-end | 2374 | 2721 |
| back-end;Developer, front-end;Developer, full-stack |
1838 | 2146 |
| back-end;Developer, full-stack | 1216 | 1411 |
| front-end | 1071 | 1229 |
| mobile | 953 | 1074 |
| desktop or enterprise applications full-stack |
668 | 779 |
| front-end;Developer, full-stack | 667 | 758 |
| back-end;Developer, desktop or enterprise applications | 528 | 617 |
As we can see above,the order of values never changed while filling the null values with bfill and ffill method.
For EdLevel we had only 993 null values. So we assigned it to bachelors degree as the number of respondents who have bachelors degree were 20,290.
All the null values were handled for all three data sets and ensured the dataset is as below.
| Columns(2020) | Before handling null | After handling null |
|---|---|---|
| Age | 19015 | 0 |
| Gender | 13904 | 0 |
| SalaryUSD | 29705 | 0 |
| Country | 389 | 0 |
| DevType | 15091 | 0 |
| Hobbyist | 45 | 0 |
| EdLevel | 7030 | 0 |
| Employment | 607 | 0 |
| Ethnicity | 18513 | 0 |
| CurrentJobSatis | 19267 | 0 |
| JobStatus | 12734 | 0 |
| LanguageDesireNextYear | 10348 | 0 |
| LanguageWorkedWith | 7083 | 0 |
| Profession | 299 | 0 |
| UndergradMajor | 13466 | 0 |
| YearsCodePro | 18112 | 0 |
| JobSeek | 2153 | 0 |
After cleaning and handling outliers in all three datasets, we started looking for valuable insights that we can draw from it.

We made use of plotly to create a Geoplot showing where the respondents are from and how it's been distributed around the world. We found that most of the respondents are from America.India is in the second position in terms of the number of respondents.

Consistent with data in all three years, We found that white or european descent has the highest participation rate overall.
fig, ax = plt.subplots(figsize=(15, 5))
sns.barplot(x = count, y = participation_rate, palette = 'Set1')
plt.xlabel('Ethnicity', size = 16)
for i, v in enumerate(count):
    ax.text(  v+3,
              i-.15,
              f'{count[i]*100/sum(count):.2f}%',
              style = 'italic',
              fontsize=14,
              )
The most popular language that developers worked on between 2018 to 2020 is JavaScript(14%). The second and third highest working language is HTML/CSS(13%) and SQL(11%). JavaScript and SQL had the same steady increasing trend over the three years. The percentage of HTML/CSS was slightly increased from 2018 to 2019. However, it dropped to the same level as 2018 in 2020. Python was responsible for about 9% in 2018. After then, it decreased to 8% in 2019 and it rose 1% in 2020.
There are some languages that were in only 2019; Elixir, Clojure, F#, Web assembly, and Erlang. Perl, Haskell, Julia were in the 2019 and 2020 with small percentages.

Most of the respondents were either back-end or full-stack developers. For those who are working as marketing and sales professionals, their percentage is lowest compare to others.

Most of the respondents are in the age range 25-29. This shows that most of the responents are those who recently joined the comapanies or those who have less than 5 years of experience.

Overall, the country which has the highest mean annual salary is the United States of America($240,000) Dollars. The second highest country which provides mean salary is Australia($164,926) Dollars. Though India has a higher number of respondents, it has the lowest mean salary of $25,213 which shows that mean salary of developed country is much higher than the developing countries.
fig = plt.figure(figsize = (20, 10))

countries = cleaned_df_2019['Country'].value_counts().sort_values(ascending = False)[:10].index.tolist()

for i, country in enumerate(countries):
    plt.subplot(4, 3, i + 1)
    temp_salaries = cleaned_df_2019.loc[cleaned_df_2019['Country'] == country, 'SalaryUSD']

    ax = temp_salaries.plot(kind = 'kde')
    ax.axvline(temp_salaries.mean(), linestyle = '-', color = 'red')
    ax.text((temp_salaries.mean() + 1500), (float(ax.get_ylim()[1]) * 0.55), 'mean = $ ' + str(round(temp_salaries.mean(),2)), fontsize = 12)
    ax.set_xlabel('Annual Salary in USD')
    ax.set_xlim(-temp_salaries.mean(), temp_salaries.mean() + 2 * temp_salaries.std())
    ax.set_title('Annual Salary Distribution in {}'.format(country))

plt.tight_layout()
plt.show()
The respondents who have done Doctorate have the highest mean salary among all other education levels. Secondly, the respondents who have done Bachelors degree has more salary than that of Masters degree holders. This may be due to years of professional coding experience and due to the higher number of respondents in that category than that of Masters degree(No of respondents in Bachelor degree is 35659 and number of respondents in masters degree is 16940)
What is interesting is that the respondents who do not have any degree have a mean salary of $90k. This shows the improvement in online learning and advancement of technology that is shifting the company from relying on University degrees.

Based on the top 5 countries where the respondents have given the survey, we categorized male and female respondents in those countries.
In terms of male and female statistics, it can be realized that the US has the relatively largest female percentage at about 10.9% followed by Canada and UK at 9.6% and 8.0% respectively. Female respondents were around 5% in India and Germany which is the least among the top 5 counties.

There are 5,788 data scientists who responded to the Stackoverflow survey in 2019. Most data scientists are from the US with 1,550 people and it is 3 times higher than data scientists from India. Followed by Germany and the UK with 427 and 339 people respectively. The rest are Canada, France, Netherlands, Brazil, Russia, and Australia which have less than 200 data scientists.

In 2019, the top three countries which have a highest mean annual salary of a data scientist are Ireland ($275,851), Luxembourg ($272,769), and the USA ($265,211). Apart from that, the mean salary of the rest countries is less than ($200,000) per year. Japan provides the highest mean annual salary among Asian countries ($118,969)

Each Stack Overflow survey has a 'LanguageWorkedWith' column, which describes programming languages that respondents worked in over the past year. We have measured and used the fraction of each language and the total, instead of using the counts of each language in a year as it is more convenient for comparison.

From 2018 to 2020 the 10 most popular programming languages remain the same: JavaScript, HTML/CSS, SQL, Python, Java, Bash/Shell/PowerShell, C#, PHP, TypeScript and C++.

We planned to predict the growth of languages for upcoming years by using time series forecasting such as the ARIMA model. Unfortunately, we have only 3 years of dataset, there is not enough data to use time series forecasting. With a very small number of observations, there is insufficient data to split the observations into training and testing. More observations are needed to build the predictive model. Further exploration in future projects may be needed to explain this question
To predict the salary of data scientists, the target SalaryUSD is divided into 2 groups: SalaryUSD < median and SalaryUSD >= median, and which are converted to a categorical variable by label encoding.
In the features selection process, there are 5 features which are Age, Country, EdLevel, DevType and YearsCodePro which provided the best accuracy scores.
Six classification models for machine learning were used to predict the salary of the data scientists. Our findings are given below.
| Sno | Model | Accuracy | R2 Score | Time |
|---|---|---|---|---|
| 1 | Decision Tree | 0.830 | 0.32 | 0.06 |
| 2 | Multinomial Naive Bayes | 0.833 | 0.33 | 0.01 |
| 3 | Gaussian Naive Bayes | 0.63 | -0.44 | 0.01 |
| 4 | Logistic Regression | 0.85 | 0.40 | 0.10 |
| 5 | Random Forest | 0.83 | 0.32 | 1.31 |
| 6 | Linear SVC | 0.85 | 0.40 | 0.03 |
Most models show relatively high accuracy scores(more than 80%), unfortunately, none of them has acceptable R2 values. The best model is Logistic Regression with R2 just approximately 0.4. It is not confidently said that Logistic Regression is a good fit to predict the salary of Data Scientists.
- Hamming loss is the fraction of labels that are incorrectly predicted ( evaluation metrics for a classifier model.)
Hamming loss value range between 0 and 1, Having HL less is the best. - The Jaccard Index, also known as the Jaccard similarity coefficient, is a statistic used in understanding the similarities between sample sets. (To measure Similarity)
Jaccard is a measurement utilized in understanding the similitudes between test sets. The estimation underscores comparability between limited example sets and is officially characterized as the size of the crossing point separated by the size of the association of the example sets.
| Sno | Model | HL | Jaccard Score |
|---|---|---|---|
| 1 | Random Forest | 0.1660 | 0.7088 |
| 2 | MLPClassifier | 0.1729 | 0.7081 |
| 3 | SGDClassifier | 0.1473 | 0.7400 |
| 4 | Logistic Regression | 0.1481 | 0.7402 |
| 5 | MultinomialNB | 0.1680 | 0.7124 |
| 6 | Linear SVC | 0.1481 | 0.7444 |
It has been found that better Hamming loss has been found in Logistic Regression and Linear SVC which is 0.14815 Jaccard similarity scores gives us the distribution of label sets when using the models.
An examination of work satisfaction variables based on Stack Over Flow survey data from 2020. Job satisfaction can be defined by factors such as compensation, benefits, work environment, team members, work-life balance, education level, place, and so on.
- Best mean cross-validation score: -0.262
- Test-set score: -0.261
Here Random Forest is used to Predict the Job satisfaction, model did not yield much better output and turned out to be very complex to get insights. Logistic Regression or Random forest Regressor which may yield good results. Proceeding with Logistic Regression to find features affecting Job Satisfaction.
By analysing the Stack Over Flow survey data from 2020, tried to find some features that are negatively and positively affecting job satisfaction in various countries. Used Sklearn library to create a Logistic Regression model. Before creting model, need to create data, Using model coefficients, features that has negative and positive effect on job satisfaction to be calculated.
- Deleted "Neither satisfied nor dissatisfied"
- Combined "Very satisfied" and "Slightly satisfied", label as "Satisfied" -->1
- Combined "Very dissatisfied" and "Slightly dissatisfied", label as "Dissatisfied"-->0
- Deleted rows "Neither satisfied nor dissatisfied"
##Finding the Accuracy of the Test by defining the model define the model
model = LogisticRegression()
# fit the model
model.fit(X, y)

# get importance
importance = model.coef_[0]

# make predictions for test data and evaluate
y_pred = model.predict(X_test)
predictions = [round(value) for value in y_pred]
accuracy = accuracy_score(y_test, predictions)
print("Accuracy: %.2f%%" % (accuracy * 100.0))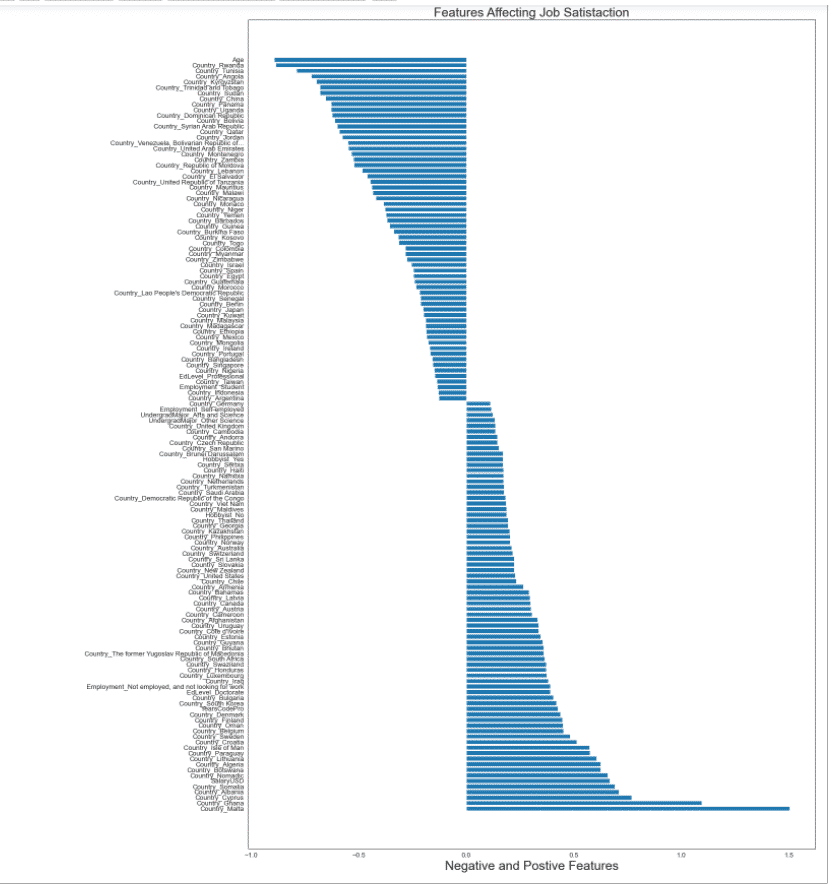
Top 2 features negatively effecting Job Satisfaction are age, country. So, in the elderly ages job satisfaction may decrease because of the personal expectation increases. In the same way, as the professional coding years increase, satisfaction may decrease.
- Among the countries; most dissatisfied countries are Angolia, Rwanda, Krygyzstan, Sudan.
- UndergradMajor and other Science,are mostly satisfied.
- Most satisfied countries Malta, Ghana, Cyprus.
Overall, we performed various analyses on the Stack overflow developer survey and derived insights from it. We found which country has the highest no of respondents, which is the most popular language, education level of respondents, different roles of developers, and so on.
Additionally, we performed machine learning models to predict the growth of languages, the salary of data scientists, what is causing job satisfaction. We build six machine learning models for the same.
This repo is crafted with ♥ and owned/maintained by @sanjay-kv