sanchayan721 / MigrantStocksVisualization

Visualization of Migration data across the globe from 1990 to 2017

Geek Repo:Geek Repo

Github PK Tool:Github PK Tool

Population Migration Data Visualization

This application is built to visualize migration of people from 1990 to 2017 and built with d3.js. Please open the appplication and interact with every element of the application to enjoy and consume the data. The best viewing experience can be achieved with a 4k monitor.
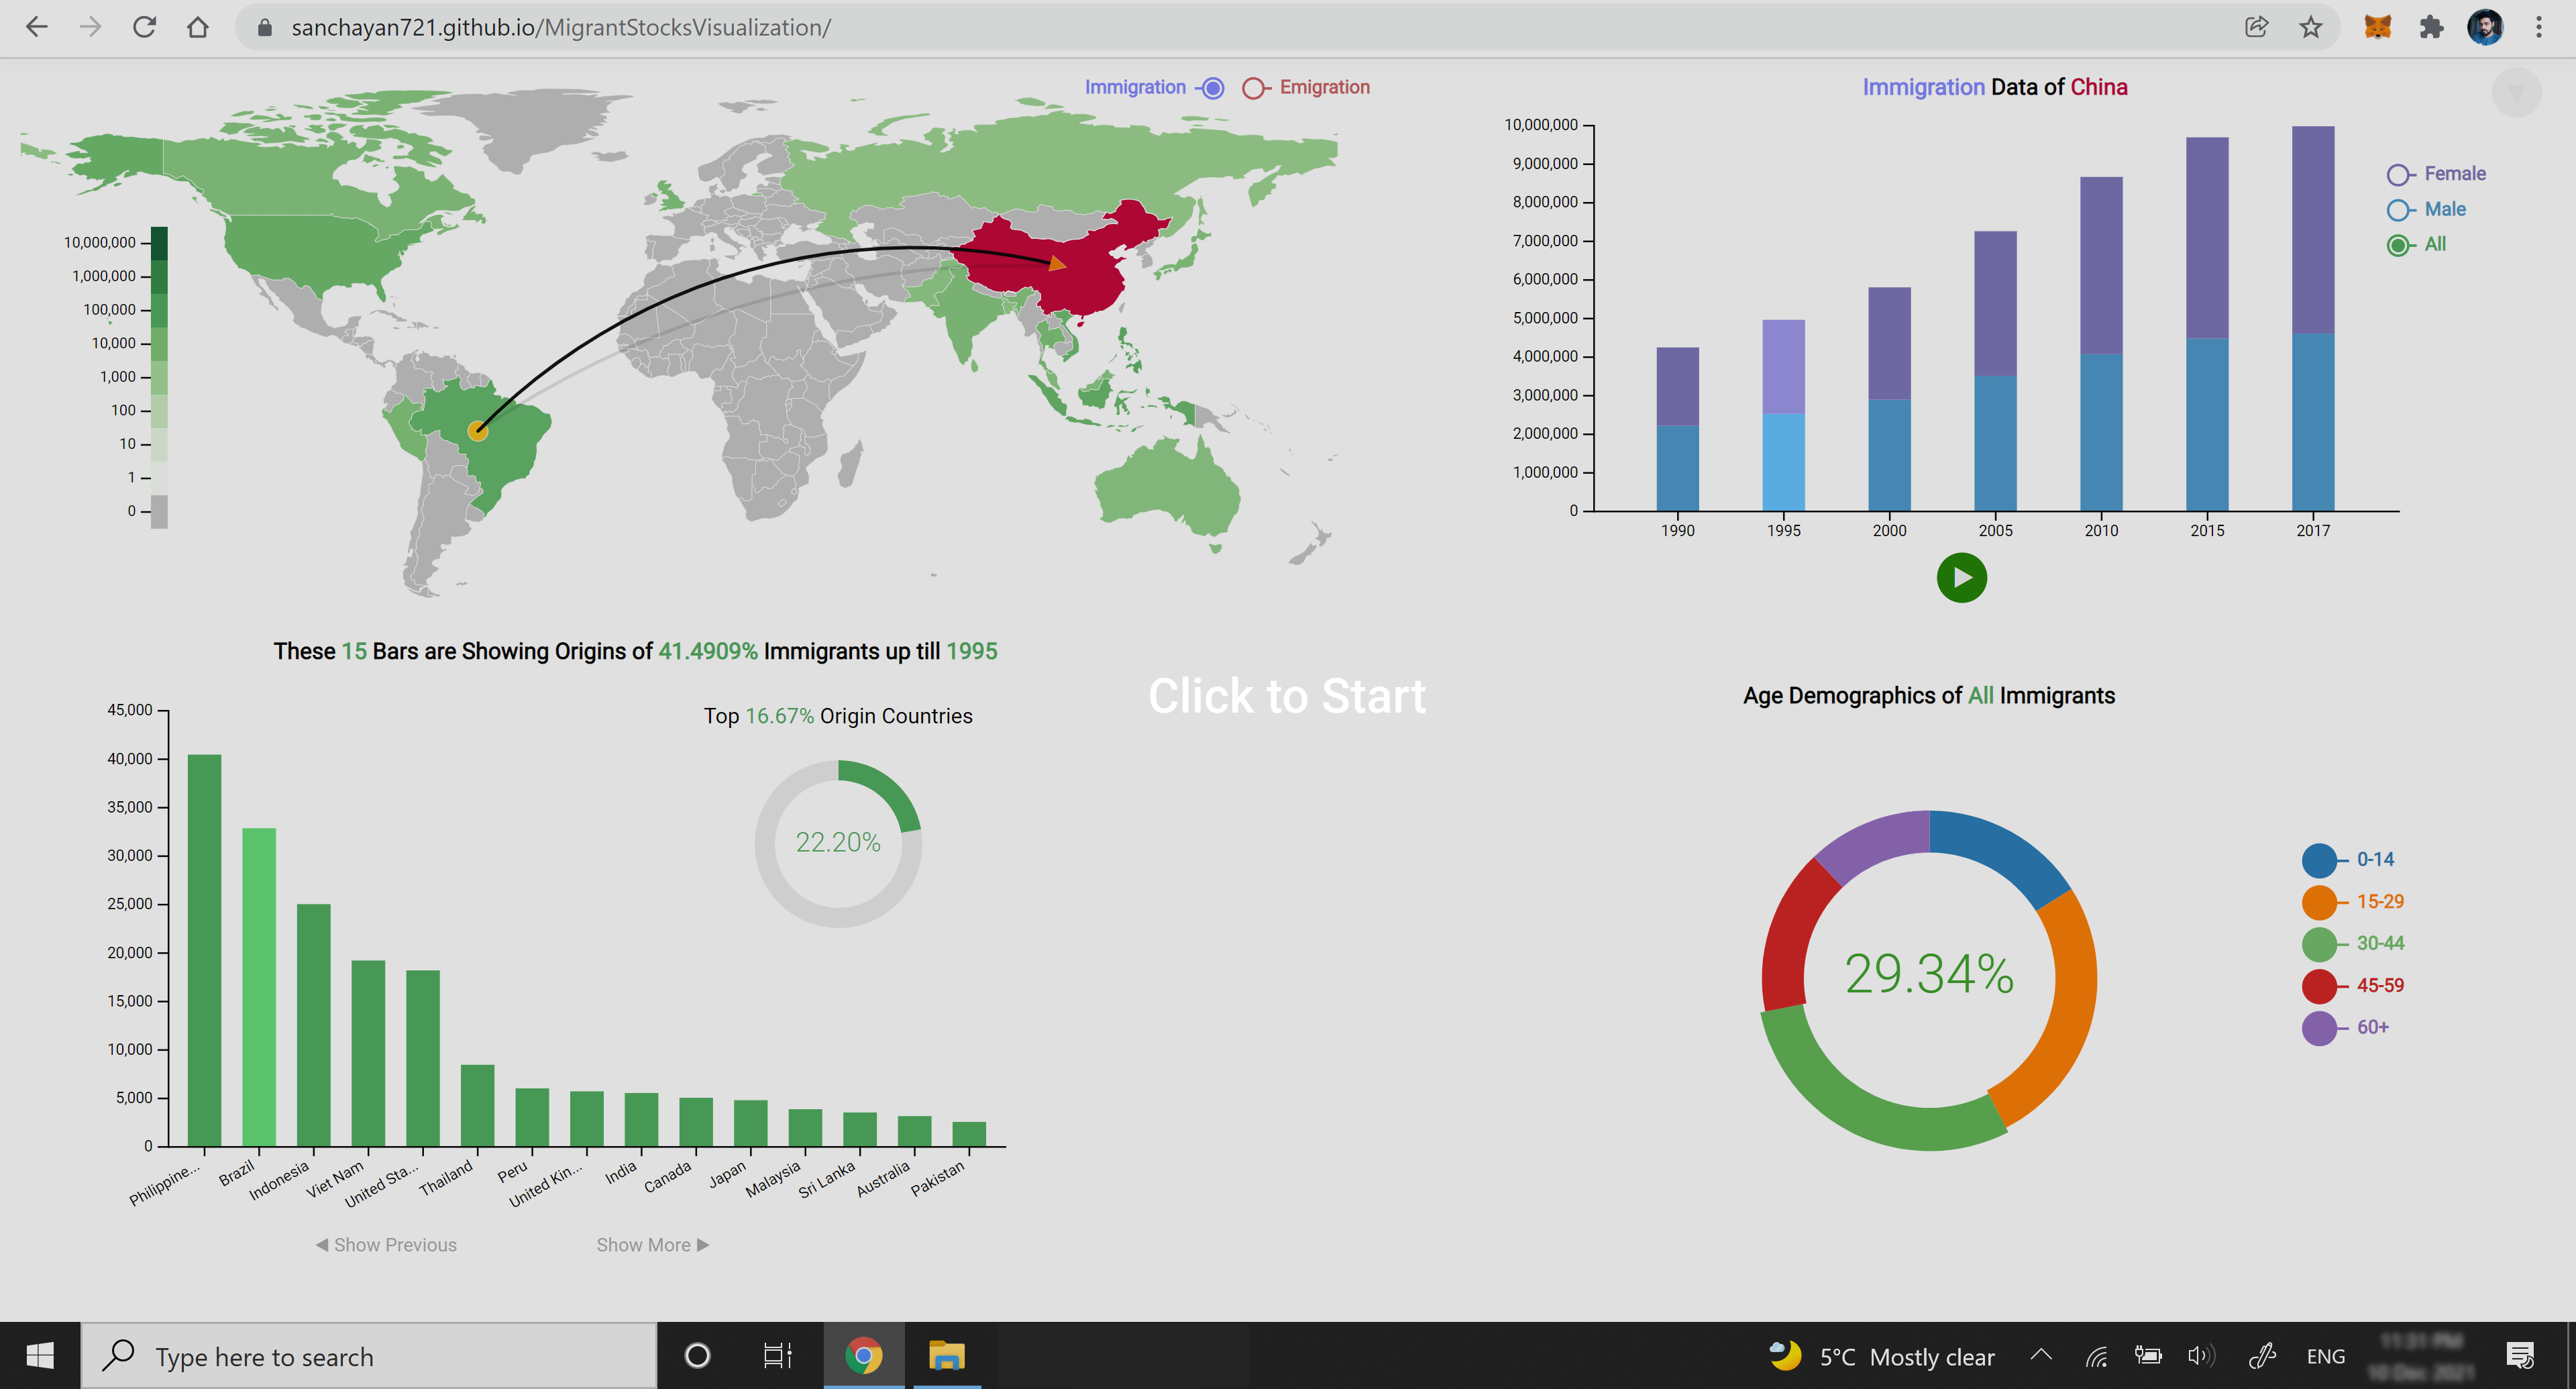
Here is a Demo of the Application

Load Application

About

Visualization of Migration data across the globe from 1990 to 2017


Languages

Language:JavaScript 89.0%Language:CSS 10.2%Language:HTML 0.8%