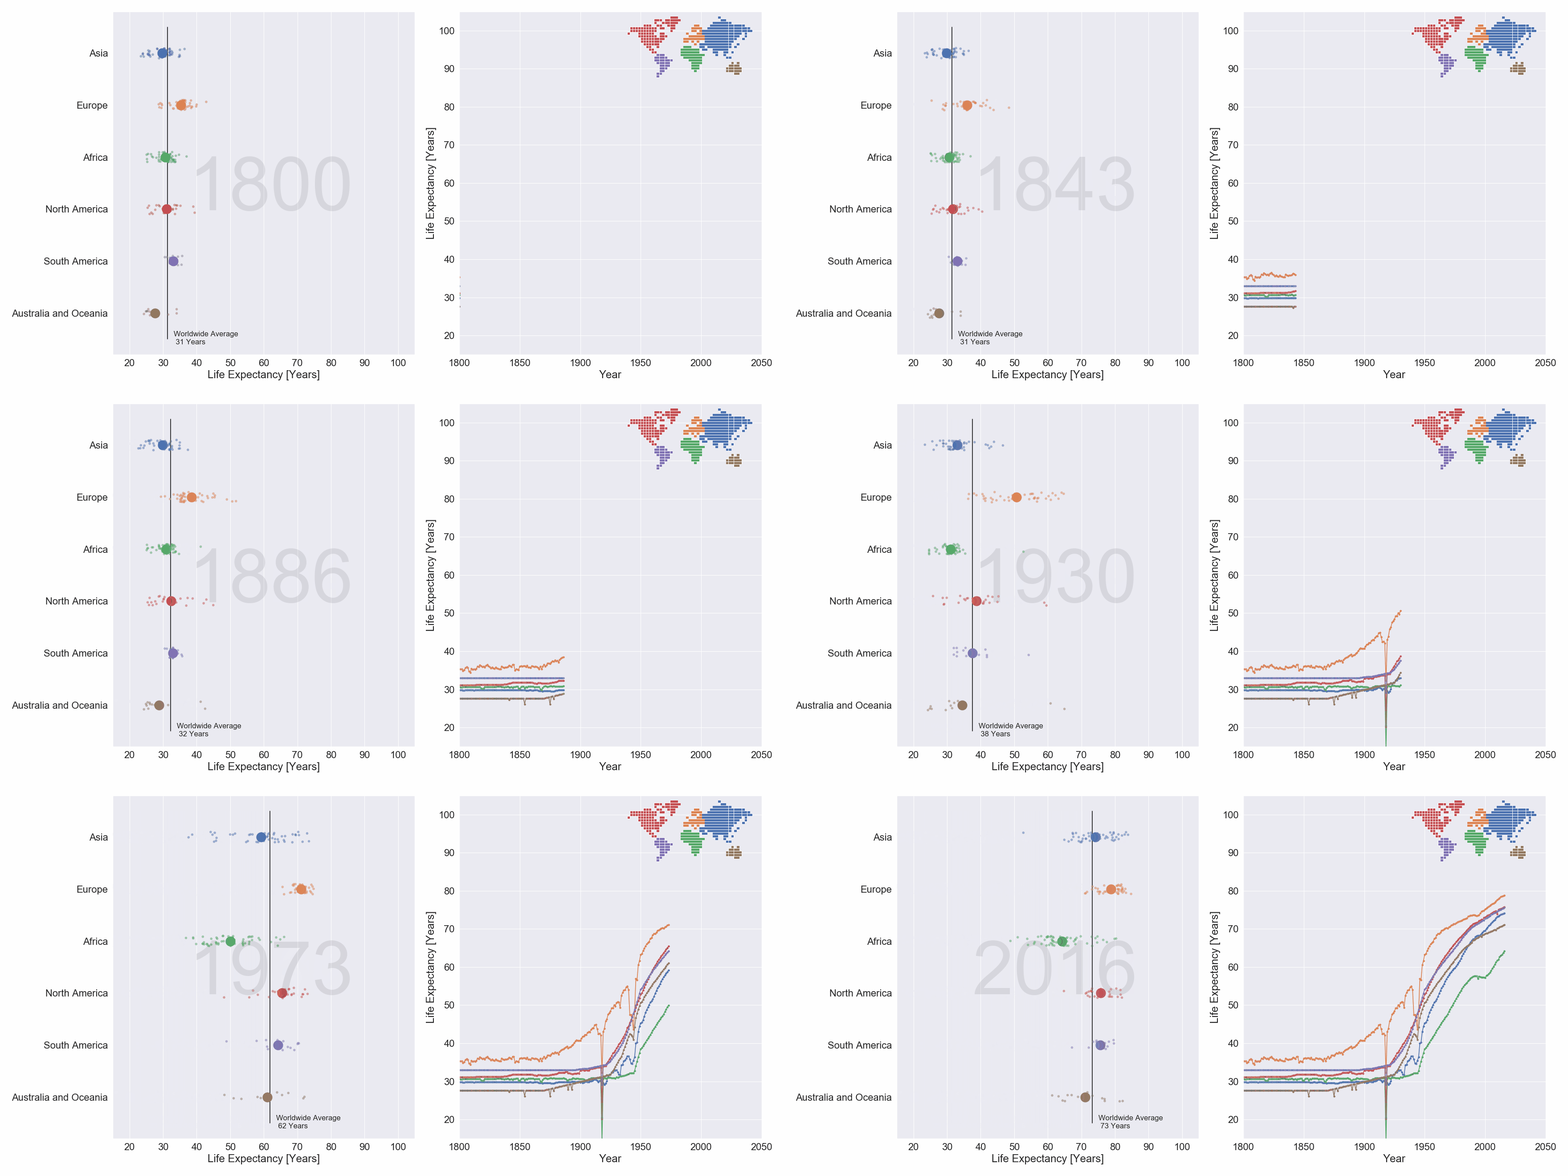
Simple Project to visualize the Change in Life Expectancy per Continent. Uses the Gapminder Life expectancy Dataset.
- Pandas is used for EDA and Data Wrangling
- Seaborn is used to create a Combination of a Stripplot and a Lineplot
- Imageio is used to create an Animation with the saved Plots
-
Clone the Git repository:
git clone https://github.com/samuelrothen/gapminder_visualization.git -
Install the requirements:
pip install requirements.txt -
Run
/src/visualization_gapminder.pyto create a single Plot. The Year of the Plot can be set with:createPlot(df, year = 2016)
-
To create the Animation, set:
create_animation = True
Distributed under the MIT License. See LICENSE for more Information.
