Visualising Image Classification Models and Saliency Maps
This project is based on the paper -Deep Inside Convolutional Networks: Visualising Image Classification Models and Saliency Maps by Karen Simonyan, Andrea Vedaldi, Andrew Zisserman Visual Geometry Group, University of Oxford.(https://arxiv.org/pdf/1312.6034.pdf)
Here is a Keras implementation of above paper from scratch in the single notebook provided here.
The paper and project is divided into two parts:-
- Visualizing convolutional model input
- Visualizing saliency maps
Visualizing convolutional model input
Here, we will see the technique for visualising the class models learnt by the image classification ConvNets. Given a learnt classification ConvNet and a class of interest, the visualisation method consists in numerically generating an image, which is representative of the class in terms of the ConvNet class scoring model. We are going to use VGG16 pretrained network or carrying out this technique. This paper lets us know what are the features expected in input image to maximize the output node score.
What an ostrich looks like -

Visualization expected by output node-

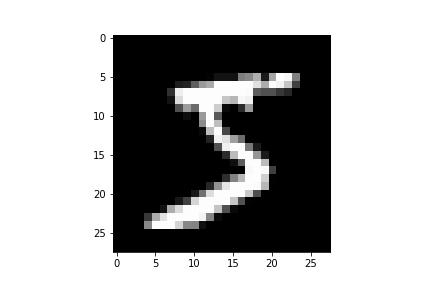
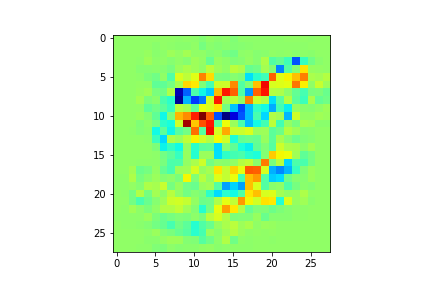
Visualizing Saliency maps
In saliency maps, we calculate the derivative of output of softmax class node with respect to the input image. Here we know the category of image beforehand. We just need to find out how does the output score changes with respect to each input pixel.This gives us an understanding of which parts of image are most discriminative.
Original image-
Saliency map-
Saliency map after smoothing-