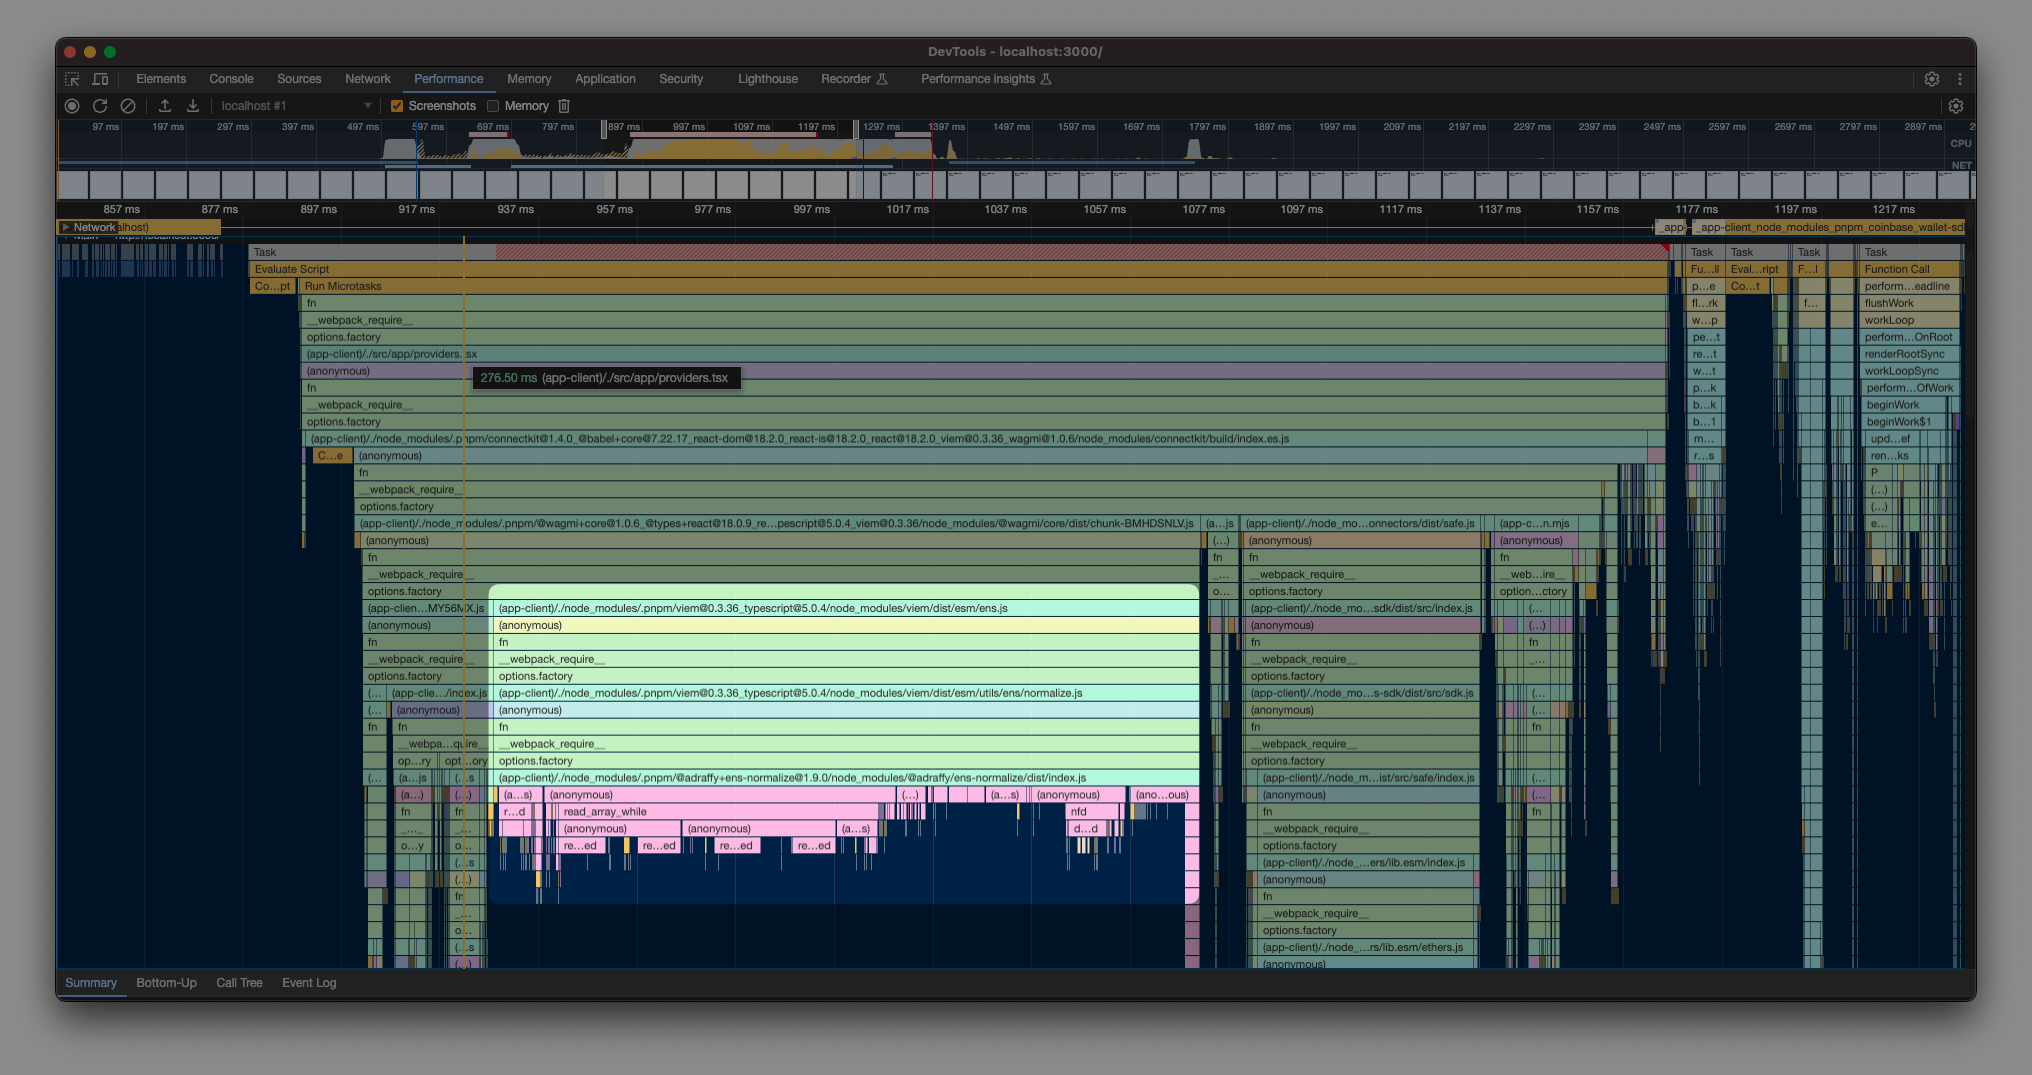
Trying to investigate initial load impacts of wagmi.
Before the browser can paint anything to the page, wagmi context seems to be doing something expensive that it takes blocking time on the main thread.
After some investigation, it seems like most of the compute is being spent on some ENS normalizations.

You can check the performance profile and investigate other things.
This is concerning because we are just showing a connect button and there is no wallet connected and it seems to be crunching some time on ENS.
In an ideal world, to optimize speed we should be able to defer loading of most of things from wagmi until user interacts with the connect button.
- Clone this repo
pnpm install- install dependenciespnpm dev- start dev server- Open
localhost:3000in Chrome - Open devtools and go to
Performancetab - Click on start profiling and reload the page (on Mac Cmd + Shift + E)
- Take profile for 3 seconds