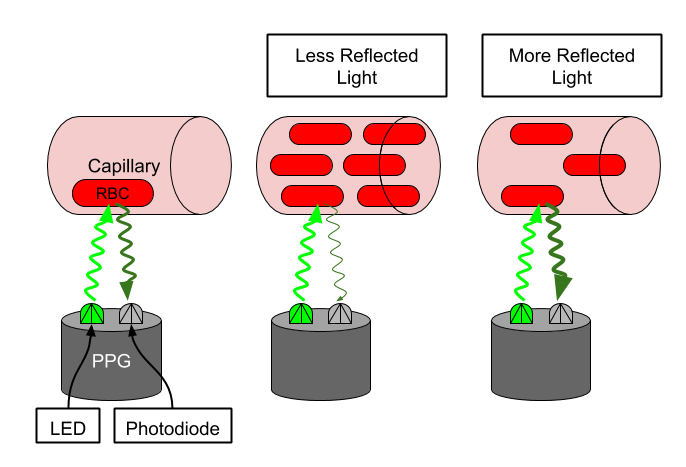
Pulse rate is typically estimated by using the PPG sensor. When the ventricles contract, the capillaries in the wrist fill with blood. The (typically green) light emitted by the PPG sensor is absorbed by red blood cells in these capillaries and the photodetector will see the drop in reflected light. When the blood returns to the heart, fewer red blood cells in the wrist absorb the light and the photodetector sees an increase in reflected light. The period of this oscillating waveform is the pulse rate.
However, the heart beating is not the only phenomenon that modulates the PPG signal. Blood in the wrist is fluid, and arm movement will cause the blood to move correspondingly. During exercise, like walking or running, we see another periodic signal in the PPG due to this arm motion. Our pulse rate estimator has to be careful not to confuse this periodic signal with the pulse rate.
We can use the accelerometer signal of our wearable device to help us keep track of which periodic signal is caused by motion. Because the accelerometer is only sensing arm motion, any periodic signal in the accelerometer is likely not due to the heart beating, and only due to the arm motion. If our pulse rate estimator is picking a frequency that's strong in the accelerometer, it may be making a mistake.
All estimators will have some amount of error. How much error is tolerable depends on the application. If we were using these pulse rate estimates to compute long term trends over months, then we may be more robust to higher error variance. However, if we wanted to give information back to the user about a specific workout or night of sleep, we would require a much lower error.
Developing a Pulse Rate Algorithm on the given training data (PPG sendor data). Then test the Algorithm and see that it has met the success criteria.
Algorithm specifications:
- Estimates pulse rate from the PPG signal and a 3-axis accelerometer.
- Essumes pulse rate will be restricted between 40BPM (beats per minute) and 240BPM
- Produces an estimation confidence. A higher confidence value means that this estimate should be more accurate than an estimate with a lower confidence value.
- Produces an output at least every 2 seconds.
Applying the Pulse Rate Algorithm on a Clinical Application and compute more clinically meaningful features and discover healthcare trends.
Used dataset in this project called as TROIKA. Zhang and co-authors presented this dataset in the paper TROIKA: A general framework for heart rate monitoring using wrist-type photoplethysmographic signals during intensive physical exercise.
- Zhilin Zhang, Zhouyue Pi, Benyuan Liu, ‘‘TROIKA: A General Framework for Heart Rate Monitoring Using Wrist-Type Photoplethysmographic Signals During Intensive Physical Exercise,’’IEEE Trans. on Biomedical Engineering, vol. 62, no. 2, pp. 522-531, February 2015. Link
Dataset contains 12 persons' PPG and three dimensions(x, y, z) accelerometer signal values. All subjects are male and they are between 18-35 years old. The data collected by wearing a wrist device while resting(30 sec) walking, running(4 min) and during a brief cooldown(30 sec) on a treadmill. All signals were sampled at 125 Hz.
The dataset also includes reference heart rate values calculated from the ECG signal for using as ground-truth.
Short comings: All of the data collected from only male subjects and age distribution is too restricted. This may not does not reflect the population. Also we don't know about skin color of the subjects. Dark and light skin may differ. For better estimation, dataset must contain diversity.
The data from this project comes from the Cardiac Arrhythmia Suppression Trial (CAST), which was sponsored by the National Heart, Lung, and Blood Institute (NHLBI). CAST collected 24 hours of heart rate data from ECGs from people who have had a myocardial infarction (MI) within the past two years.[1] This data has been smoothed and resampled to more closely resemble PPG-derived pulse rate data from a wrist wearable.[2]
-
CAST RR Interval Sub-Study Database Citation - Stein PK, Domitrovich PP, Kleiger RE, Schechtman KB, Rottman JN. Clinical and demographic determinants of heart rate variability in patients post-myocardial infarction: insights from the Cardiac Arrhythmia Suppression Trial (CAST). Clin Cardiol 23(3):187-94; 2000 (Mar)
-
Physionet Citation - Goldberger AL, Amaral LAN, Glass L, Hausdorff JM, Ivanov PCh, Mark RG, Mietus JE, Moody GB, Peng C-K, Stanley HE. PhysioBank, PhysioToolkit, and PhysioNet: Components of a New Research Resource for Complex Physiologic Signals (2003). Circulation. 101(23):e215-e220.
Phisiology of behind this algorithm is movement of the blood in the vessels. During systole, capillaries fill with blood and during diastole, blood inside the capillaries decreases. The PPG sensor uses a green light. This light absorbed by the RBC. The changes in the amount of reflected light is detected by the sensor. By this data, we understand the phase of the heart cycle.
The algorithm is composed of several functions. Calculates heart rate without artefacts. We load ppg and acc signal values from files, bandpass filtering on raw signals between 40 and 240 BPM and apply the Fourier transform. This cut-off values determined by physiologic heart rates. The algorithm computes largest FFT coefficient, pick the PPG frequency with this as the best estimate. After finding predicted frequency, for understanding that this value not comes from movement artefacts, compare this value with acc signals frequency. If difference equals 0, the algorithm tests the PPG frequency with the second largest FFT coefficient.
The algorithm outputs the array of mean absolute errors calculated between predicted vs ground-truth heart rate array and array of confidence score. The confidence includes how much energy in the frequency spectrum is concentrated near the pulse rate estimate. The confidence represents the confidence that the estimated pulse rate represents a correct estimated pulse rate.
Insightful caveats and failure-modes of the algorithm: The algorithm is based on estimation of strong frequency spectral in the PPG signals relative to the entire frequency spectral of the PPG signals. The wearer's motion can produce strong signals which can be confused for the pulse rate resulting in algorithm failure.
import glob
import os
import numpy as np
import pandas as pd
import scipy as sp
import scipy.io
import scipy.signal
- pulse_rate_starter.ipynb: the notebook for Part1 (Pulse Rate Algorithm)
- unit_test.ipynb: the notebook for testing the algorithm
- clinical_app_starter.ipynb: the notebook for Part2(Clinical Application)