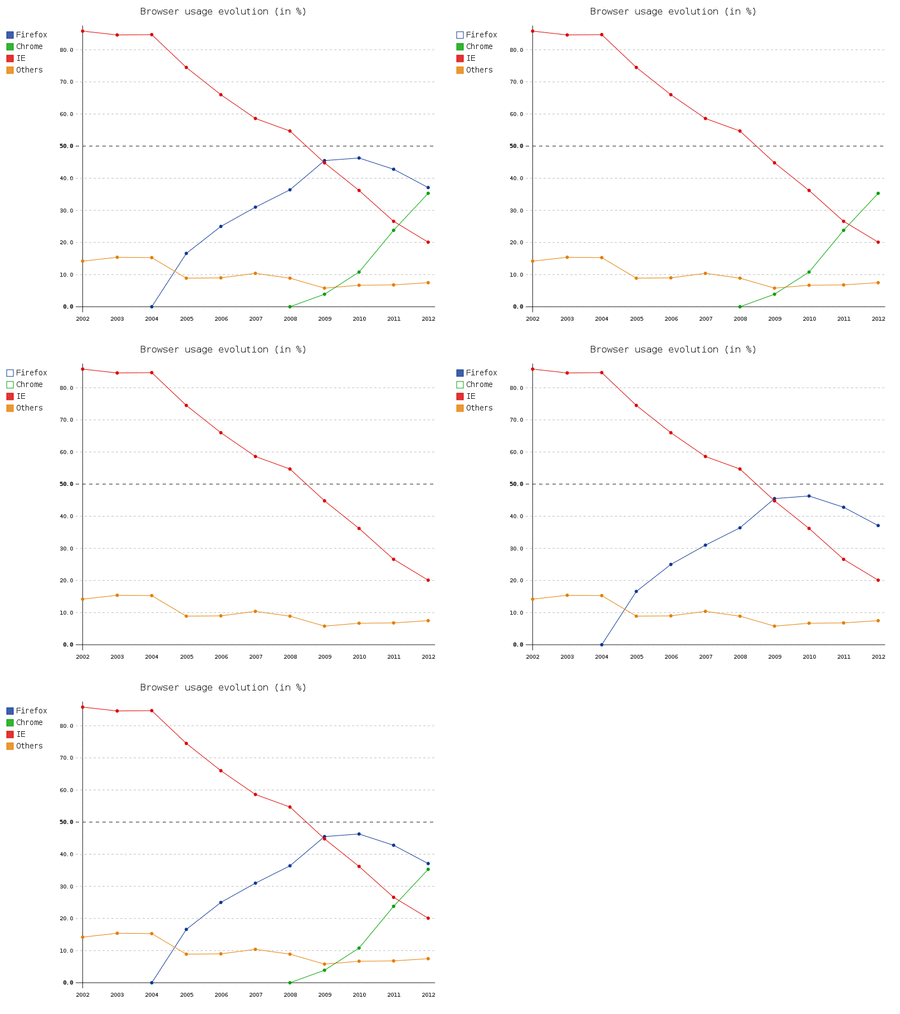
A JavaScript module that allows you to toggle the visibility of graphs in the charts generated by pygal when viewing them in a browser.
When you generate the charts in Python, simply append a link to this module in the list of JavaScript modules that should be embedded in the chart:
import pygal

js = [
  'https://kozea.github.com/pygal.js/javascripts/svg.jquery.js',     # Original
  'https://kozea.github.com/pygal.js/javascripts/pygal-tooltips.js', # Original
  'https://rawgit.com/s3rvac/pygal-toggle-graphs/master/pygal-toggle-graphs.js'
]

line_chart = pygal.Line(js=js)
# Populate the chart with data.
# ...
line_chart.render_to_file('graph.svg')
After that, when viewing the chart on a website, click on a legend to toggle the visibility of the corresponding graph (show/hide). For a description of how to embed a chart on your website, consult the documentation of pygal.
An online example can be seen here or in the GIF screencast below.
- The module should work with any type of a chart.
- It requires the presence of the original JavaScript modules that are distributed with pygal. At the time of writing, these are the two modules listed above in the usage description.
- It was tested with pygal 1.4-2.3 and Mozilla Firefox 27-52, Google Chrome 33-57, Opera 20-36, and Apple Safari 5.1.
- The implementation is inspired by the scripts in pygal.js.
Copyright (c) 2014 Petr Zemek s3rvac@gmail.com
Distributed under GNU LGPLv3:
This program is free software: you can redistribute it and/or modify it
under the terms of the GNU Lesser General Public License as published by
the Free Software Foundation, either version 3 of the License, or (at your
option) any later version.

This program is distributed in the hope that it will be useful, but WITHOUT
ANY WARRANTY; without even the implied warranty of MERCHANTABILITY or
FITNESS FOR A PARTICULAR PURPOSE. See the GNU Lesser General Public
License for more details.

You should have received a copy of the GNU Lesser General Public License
along with this program. If not, see <http://www.gnu.org/licenses/>.
