
- Provides auto discovery of PHP-FPM pools (LLD)
- Detects pools that listen via socket and via TCP
- Supported types of PHP process manager:
- dynamic
- static
- ondemand. Such pools are invisible (undiscoverable) if they are not active because of their nature, i.e. when no PHP-FPM processes related to the pools spawned during the discovery process of Zabbix agent. After a pool has been discovered for the first time, it becomes permanently visible for Zabbix. Regular checks performed by Zabbix agent require at least one active PHP-FPM process that can report the status, and if such process does not exist, then it will be spawned. As a result, Zabbix agent will always report that there's at least one active PHP-FPM process for the pool. Besides, there's a chance that such behaviour may have a negative impact on the pool's performance and you may consider changing to another type of process manager, for example, dynamic.
- Supports multiple PHP versions, i.e. you can use PHP 7.2 and PHP 7.3 on the same server and we will detect them all
- Easy configuration
- Supports ISPConfig
- Script is in pure
bash: no need to installPerl,Goor other languages.
We capture only useful data from host and PHP-FPM status page:
-
Number of CPUs
-
For each pool:
- Accepted Connections Per Second - the number of requests accepted by the pool
- Active Processes - the number of active processes
- Idle Processes - the number of idle processes
- Max Children Reached – the number of times, the process limit has been reached, when pm tries to start more children (works only for pm
dynamicandondemand) - CPU Utilization - CPU load for all processes of the pool in %
- CPU Average Utilization - CPU load for all processes of the pool in % normalized by number of CPUs
- Listen Queue - the number of requests in the queue of pending connections
- Max Listen Queue - the maximum number of requests in the queue of pending connections since FPM has started
- Listen Queue Length - the size of the socket queue of pending connections. This value is defined by the backlog option in your pool's configuration. On Debian the length is always reported zero for pools that listen via socket.
- Queue Utilization - queue usage in %
- Memory Used - how much RAM used by the pool in bytes
- Memory Utilization - how much RAM used by the pool in %
- Process Manager -
dynamic,ondemandorstatic, see PHP manual. - Slow Requests - the number of requests that exceeded your
request_slowlog_timeoutvalue. - Start Since - number of seconds since FPM has started
- Start Time - the date and time FPM has started
History storage period is from 1 hour to 1 day (depends on specific item), trend storage period is 365 days that's optimal for environments with multiple websites. Data is captured every minute. These timings can be adjusted in template or per host if needed.
| Title | Severity | Description |
|---|---|---|
| Too many connections on pool | High | It means this pool is under high load. Please, make sure that your website is reachable and works as expected. For high load websites with huge amount of traffic please manually adjust this trigger to higher values (default is 500 concurrent connections). For websites with low or standard amount of visitors you may be under DDoS attack. Anyway, please, check the status of your server (CPU, memory utilization) to make sure that your server can handle this traffic and does not have performance issues. |
| PHP-FPM uses too much memory | Average | Please, make sure that your server has sufficient resources to handle this pool, and check that the traffic of your website is not abnormal (check that your website is not under DDoS attack). |
| PHP-FPM detected slow request | Warning | PHP-FPM detected slow request on pool. A slow request means that it took more time to execute than expected (defined in the configuration of your pool). It means that your pool has performance issues: either it is under high load, your pool has non-optimal configuration, your server has insufficient resources, or your PHP scripts have slow code (have bugs or bad programming style). You need to set request_slowlog_timeout and slowlog options in your pool's configuration if you want to use this trigger. Otherwise the trigger will never be fired. |
| The queue utilization for pool reached 25% | Warning | The queue for this pool reached 25% of its maximum capacity. Items in queue represent the current number of connections that have been initiated on this pool, but not yet accepted. It typically means that all the available server processes are currently busy, and there are no processes available to serve the next request. Raising pm.max_children (provided the server can handle it) should help keep this number low. This trigger follows from the fact that PHP-FPM listens via a socket (TCP or file based), and thus inherits some of the characteristics of sockets. Low values of the listen queue generally result in performance issues of this pool. The queue length is defined by the backlog option in your pool's configuration. |
| The queue utilization for pool reached 50% | Average | The queue for this pool reached 50% of its maximum capacity. Items in queue represent the current number of connections that have been initiated on this pool, but not yet accepted. It typically means that all the available server processes are currently busy, and there are no processes available to serve the next request. Raising pm.max_children (provided the server can handle it) should help keep this number low. This trigger follows from the fact that PHP-FPM listens via a socket (TCP or file based), and thus inherits some of the characteristics of sockets. This pool already has performance issues. Please, check that your server has enough resources and adjust the configuration of this pool to handle more concurrent requests, otherwise you can suffer serious degraded performance. The queue length is defined by the backlog option in your pool's configuration. |
| The queue utilization for pool reached 85% | High | The queue for this pool reached 85% of its maximum capacity. Items in queue represent the current number of connections that have been initiated on this pool, but not yet accepted. It typically means that all the available server processes are currently busy, and there are no processes available to serve the next request. Raising pm.max_children (provided the server can handle it) should help keep this number low. This trigger follows from the fact that PHP-FPM listens via a socket (TCP or file based), and thus inherits some of the characteristics of sockets. This pool already has serious performance issues. Please, check that your server has enough resources and adjust the configuration of this pool to handle more concurrent requests, otherwise you can face severe errors when new requests can't be processed and will be rejected generating errors such as HTTP 500. The queue length is defined by the backlog option in your pool's configuration. |
| PHP-FPM manager changed | Information | The process manager of PHP-FPM for this pool has changed. |
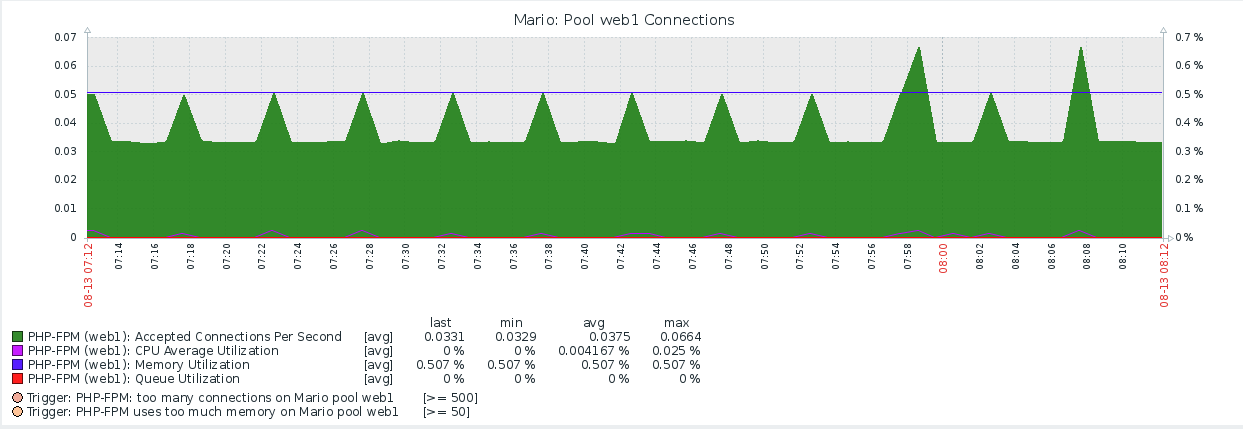
Displays the following data:
- Accepted connections per second
- CPU average utilization in %
- Memory utilization in %
- Queue utilization in %
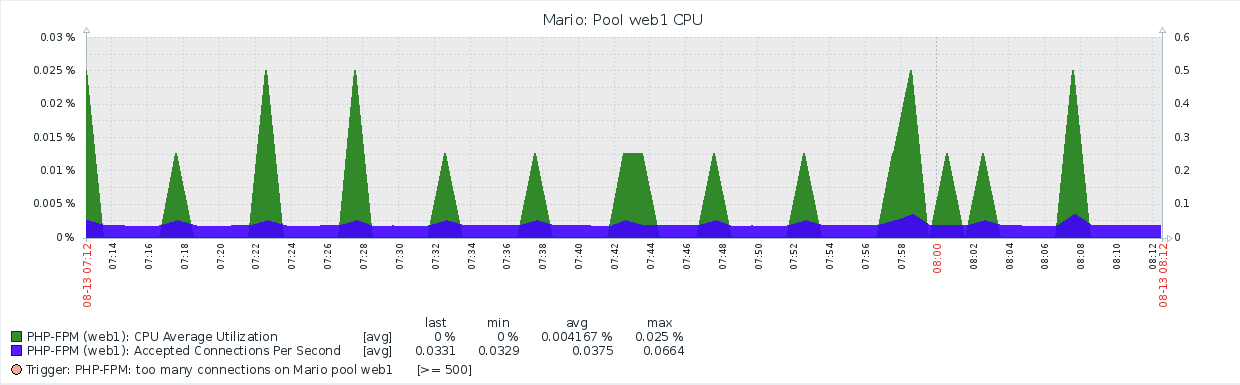
Displays the following data:
- CPU average utilization in %
- Accepted connections per second
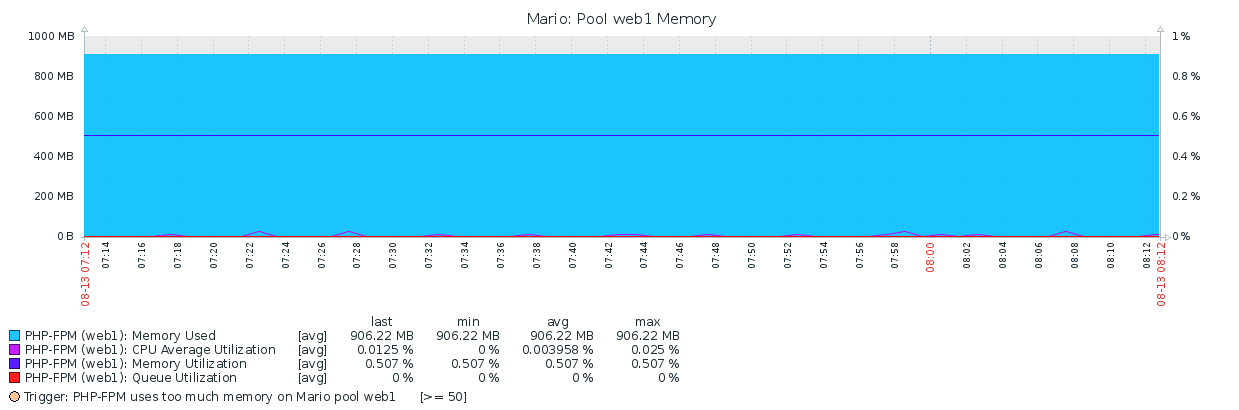
Displays the following data:
- Memory used in bytes
- CPU average utilization in %
- Memory utilization in %
- Queue utilization in %
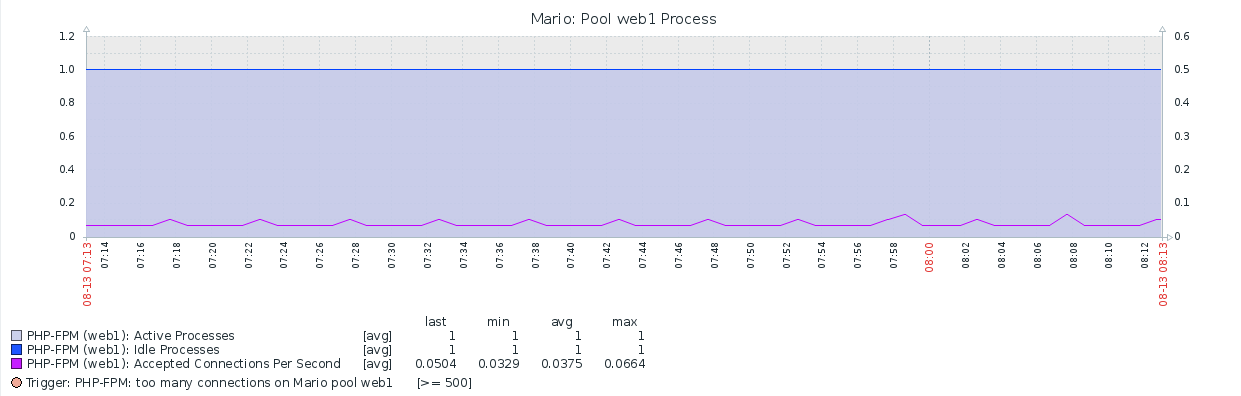
Displays the following data:
- Active processes
- Idle processes
- Accepted connections per second
Displays the following data:
- Listen Queue
Displays the following data:
- Max Children Reached
- Accepted connections per second
Screens are based on the graphs above:
- Connections
- Processes
- CPU utilization
- Memory utilization
- Queue
- Max children reached

Please refer to Wiki.
Please refer to Wiki.
- PHP. Should work with any version of PHP-FPM (starting with PHP 5.3.3)
- Zabbix 4.0.x and later.
- ISPConfig. Can work with any version of ISPConfig as long as you have a valid PHP-FPM status page configuration there.
- Minimal
bashversion 4. - OS
- Debian 8 Jessie or newer
- Ubuntu 20 Focal, 18 Bionic, 16 Xenial, 14 Trusty. Other versions are supported if they are present in the Zabbix repository.
- CentOS 6 or newer
- RHEL 5 or newer
- Travis CI
- PHP 7.4, 7.3, 7.2, 7.1, 7.0
- Zabbix 5.0.1, 4.4.4, 4.2.5, 4.0.20, 4.0.16, 4.0.4
- Debian 10, 9
- Ubuntu 18 Bionic, 16 Xenial, 14 Trusty
- CentOS 7
- Apache web server
- NGINX web server
- ISPConfig 3.1.14p2, 3.1.15p3