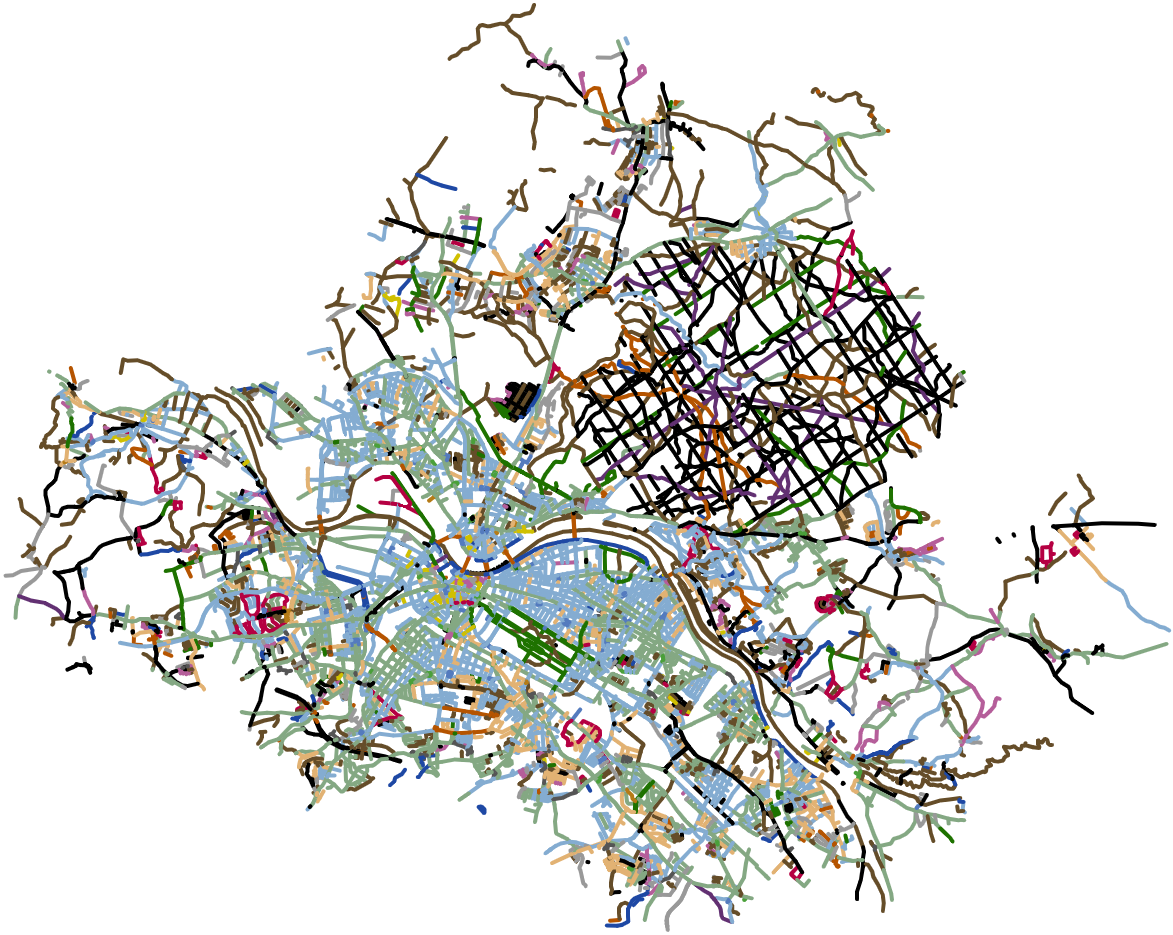
This interactive map overlay visualizes streets extracted from OpenStreetMap (OSM) data. Coloring is done based on grouping common patterns in street names. The Web-based map is created using OpenLayers. Several pre-processing steps are recommended to increase the performance of data loading when create the map overlay.
Since street names, and thus street name patterns, are specific to the regional language and other cultural as well as geographical characteristics, the configuration of name patterns has to be tailored to the region of the used OSM data. The example data used here is tailored to OSM data of the city of Dresden, Germany. The following screenshot shows the visualization created by this project with Dresden OSM data input.
The geographical region to be displayed has to be available as an OSM XML file. Place it somewhere in the project directory. You may configure the used filename, the map center coordinates fitting your region and the zoom level in the top part of the JavaScript file. Optionally, an OSM tile background can be displayed. Therefore, an opacity level is provided with a value between 0 (invisible) and 1 (fully visible).
The hardest, but most creative and rewarding, part is to set up regular expressions matching the street names from the provided OSM data. Expressions and the assigned colors are configured in a map within the constructor of the JavaScript class ColorfulStreetsMap.
With the OSM data file and configuration set up, serve the directory as static content by a Web server and point your Web browser to index.html. After several seconds, depending on the amount of data to be processed, the map appears. It has panning and zooming capabilities.
After configuring the OSM file to data-clipped-highways.osm, the project can be built, run and stopped like this:
docker build -t csm .
docker run -d --rm --name csm -p 80:80 csm
docker stop csmFirst, OSM data has to be obtained for your desired region. Get it via the OSM API with a bounding box specified. An example API call with a bounding box set within Dresden would be:
https://api.openstreetmap.org/api/0.6/map?bbox=13.720,51.03,13.730,51.04
Alternatively, pre-exported data can be used such as from bbbike.org, which provides OSM data of more than 200 regions worldwide. The zipped file Dresden.osm.gz has a current size of about 63 MiB. The extracted size of this example OSM data is 442 MiB.
Several steps can be done to reduce the OSM data file's size and therefore increase the processing performance.
Clipping the resulting data is done with a more accurate shapefile defining polygons, since the previously provided bounding box in the API call is only a rectangle. Pre-built shapefiles may be downloaded from polygons.openstreetmap.fr with the required id parameter, which is obtained from nominatim.openstreetmap.org by searching for your region or city (copy the numeric OSM relation id). The id of Dresden is 191645. Assume, you have downloaded and saved the corresponding shapefile as Dresden.poly. Now, use the converting tool osmconvert to cut your data along the polygon:
osmconvert -B=Dresden.poly --complete-ways --drop-broken-refs --drop-author --drop-version Dresden.osm > Dresden-clipped.osmAdditional command line switches cut out unused metadata. The result size of the clipped OSM data is about 131 MiB.
osmfilter is used as a tool to keep only streets using the key highway. The example command for the clipped file Dresden-clipped.osm serving as input with an output file size of about 30 MiB:
osmfilter --keep="highway=*" Dresden-clipped.osm > Dresden-clipped-highways.osmThe resulting OSM data could be reduced in size to less than 7 percent of the original export data. It can now be processed by the OpenLayers vector renderer provided by this Web application. The loading time is about 6 to 7 seconds. Of course, the described processing steps may reproduced for any region.
