Grafana data source plugin for Chaos Mesh.
Require: Chaos Mesh >= 2.1.0, Grafana >= 7.0.0
- Visualize Chaos Events on the table
- Show Chaos Events on the graph with Annotations
- Display different Chaos Events by Variables
Note:
Because Grafana is not yet accepting the plugin submission for Chaos Mesh Data Source, it can't be installed using
grafana-cliat this time.The following steps show how to install the Data Source plugin locally.
Download the plugin zip package with the following command or go to https://github.com/chaos-mesh/datasource/releases to download:
curl -LO https://github.com/chaos-mesh/datasource/releases/download/v2.1.0/chaosmeshorg-datasource-2.1.0.zipAfter downloading, unzip:
unzip chaosmeshorg-datasource-2.1.0.zip -d YOUR_PLUGIN_DIRThen update and save the grafana.ini file:
[plugins]
  allow_loading_unsigned_plugins = chaosmeshorg-datasource
Finally, restart Grafana to load the plugin.
Once installed, go to Configuration -> Data sources and add Chaos Mesh, then go to the configuration page:
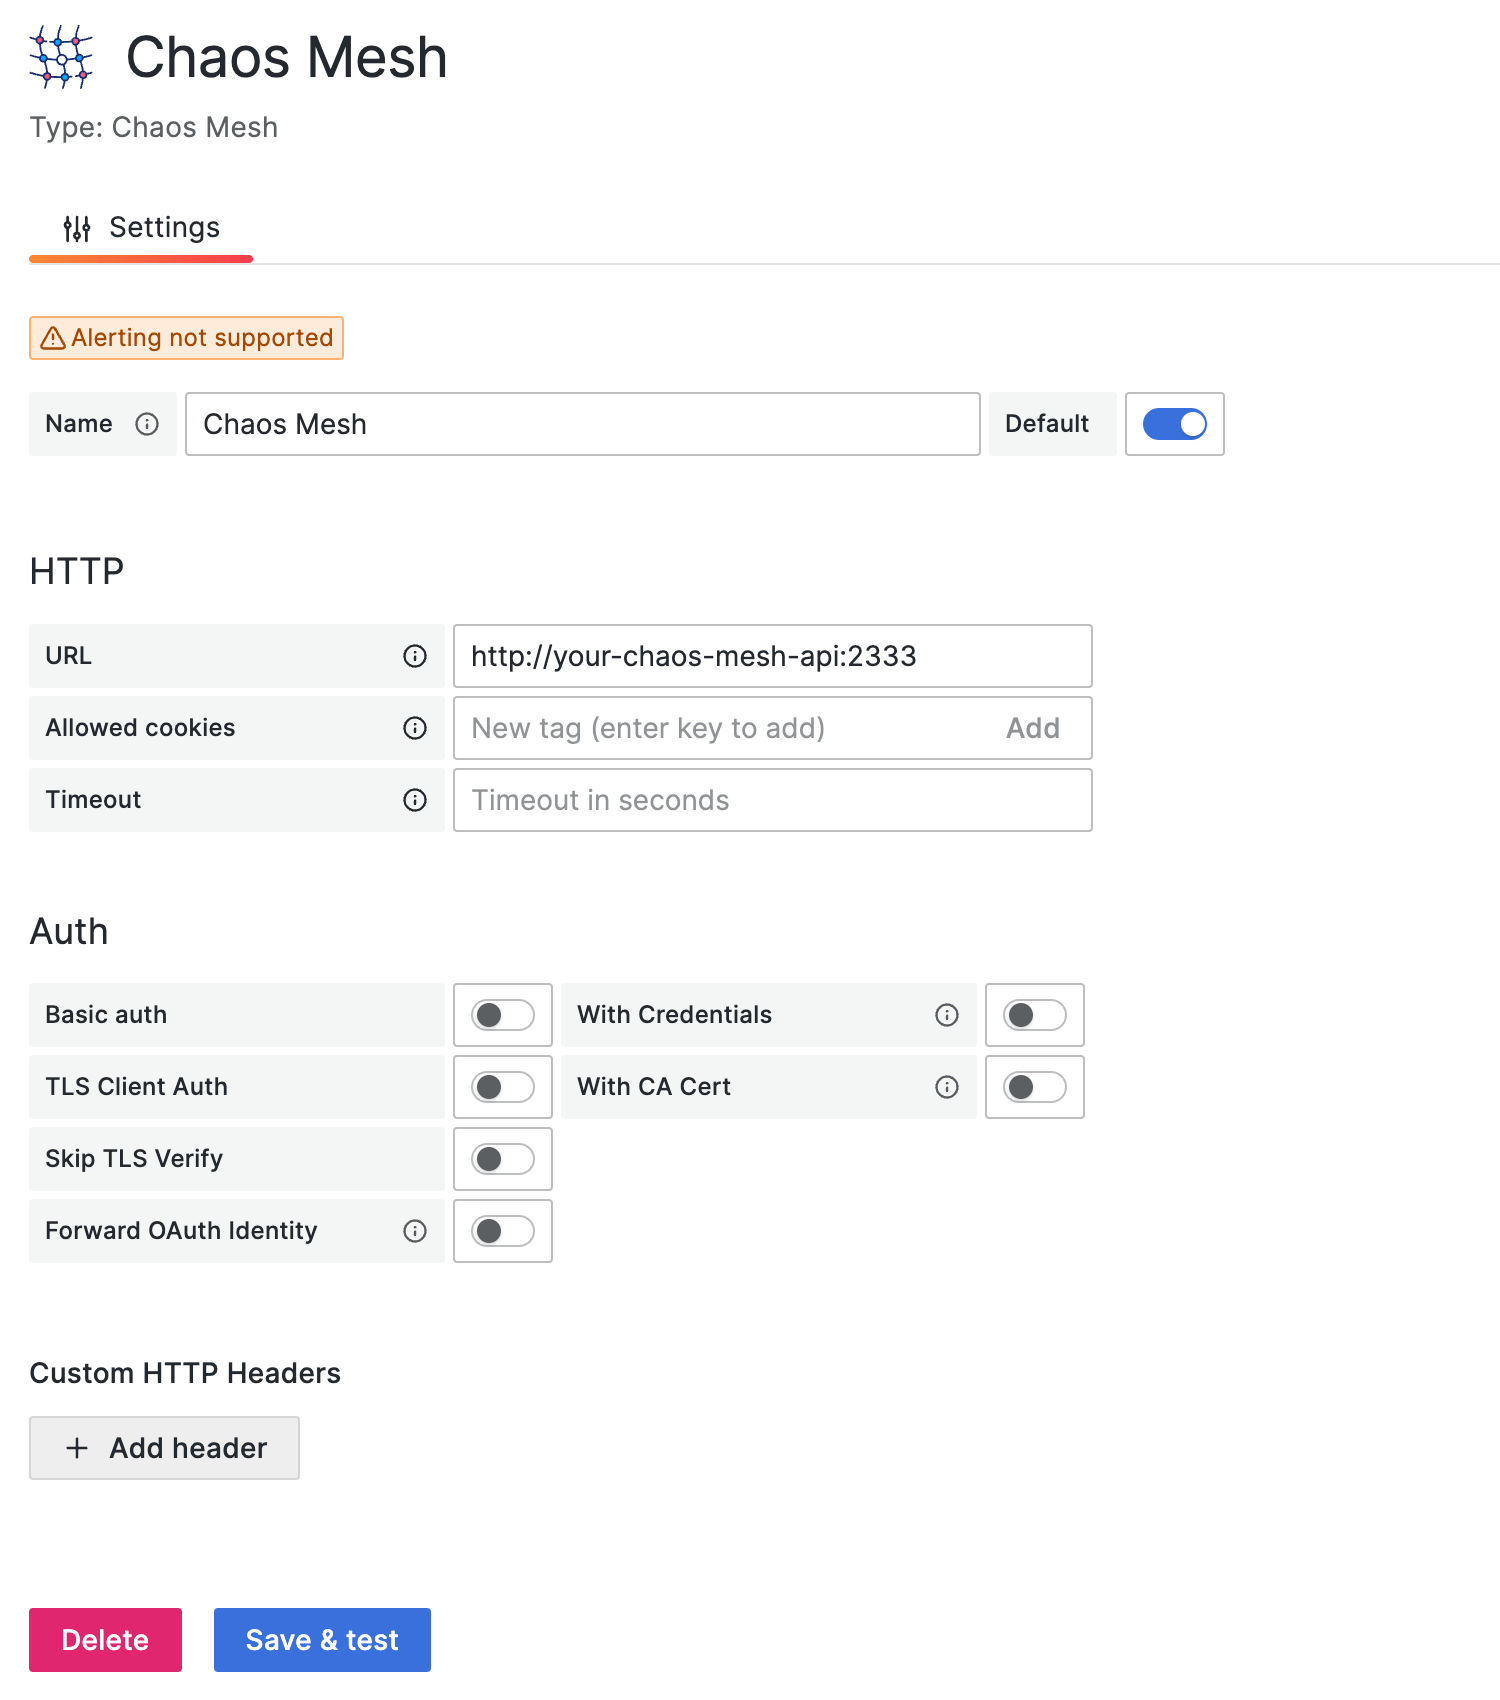
Only the URL field needs to be filled in, the other fields can be ignored.
Assuming you have Chaos Mesh installed locally, Dashboard will export the API on port 2333 by default. So, if you haven't changed anything, you can just fill in http://localhost:2333.
Then use the port-forward command to activate:
kubectl port-forward -n chaos-testing svc/chaos-dashboard 2333:2333Finally, click Save & Test to test the connection. If it shows a successful notification, the setup is complete.
The Data Source plugin looks at the Chaos Mesh through the lens of events, and the following options are responsible for filtering the different events:
- Object ID - Filter by object uuid
- Namespace - Filter by different namespace
- Name - Filter by object name
- Kind - Filter by kind (PodChaos, Schedule...)
- Limit - Limit the number of events
They will be passed as parameters to the /api/events API.
You can integrate Chaos Mesh's events into the panel via Annotations, the following is a sample creation:
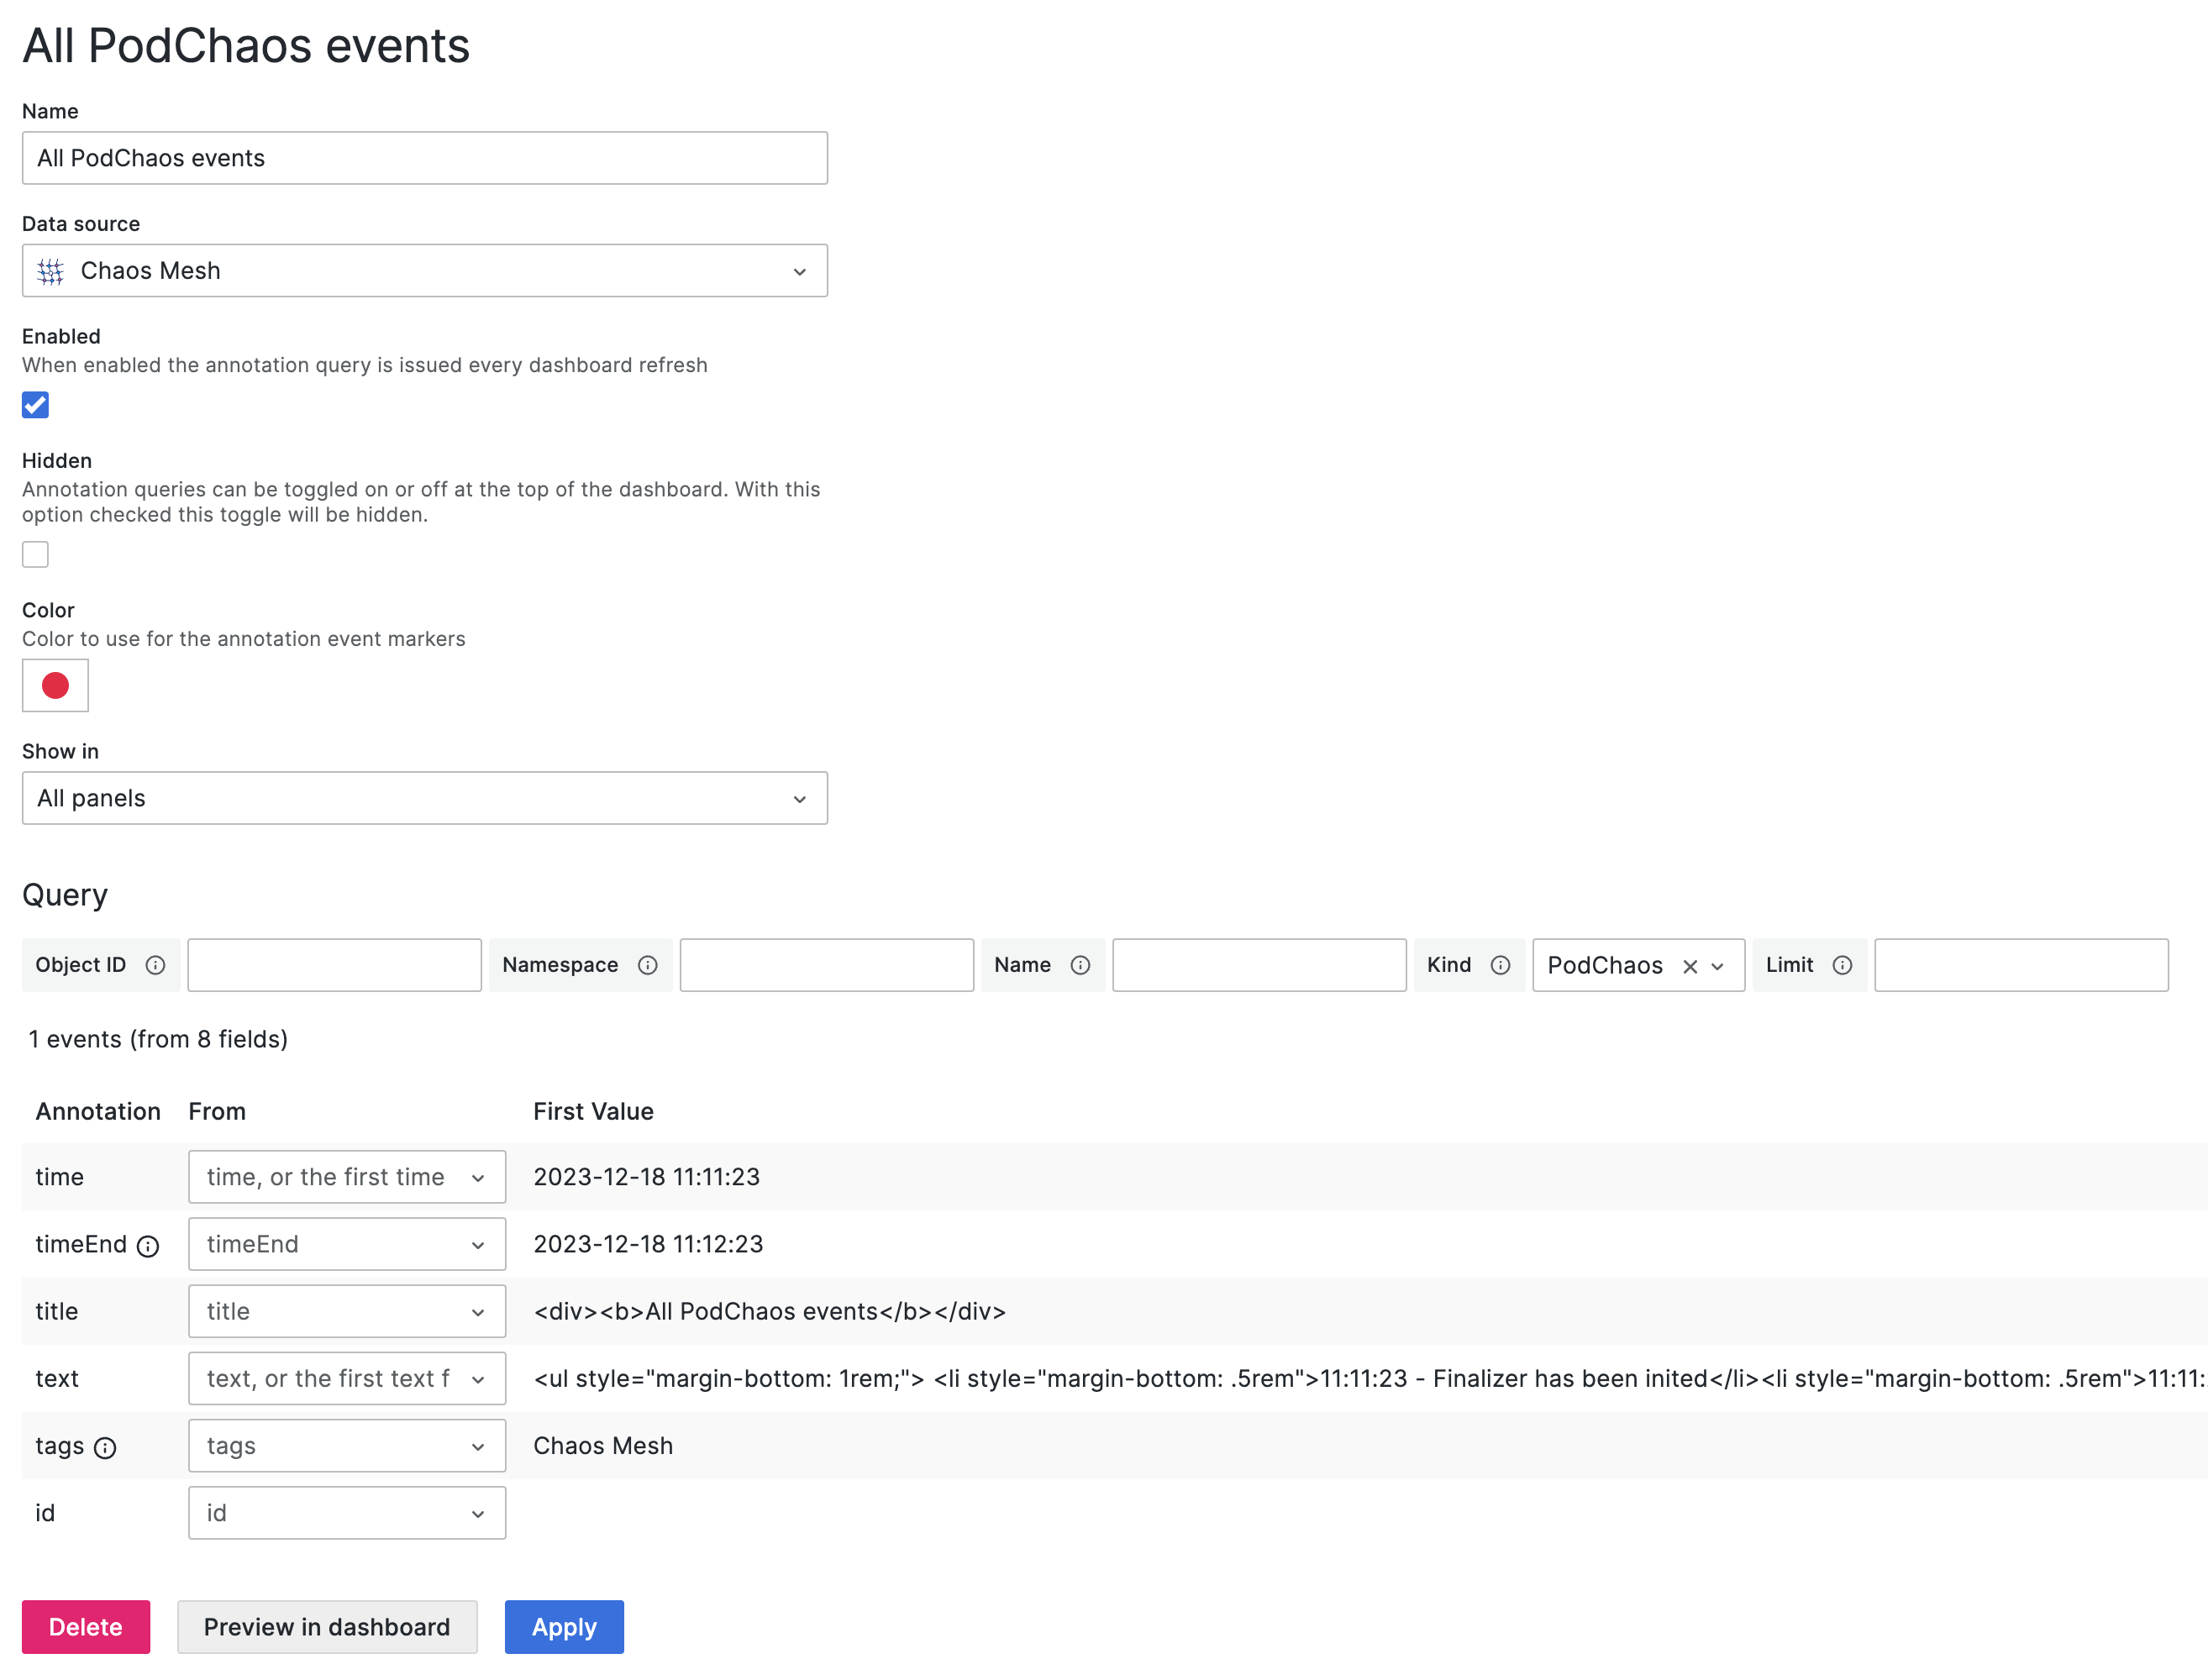
Please refer to the contents of Query to fill in the corresponding fields.
If you choose the type to Query and select the data source to Chaos Mesh, you can retrieve
the variables by different metrics:
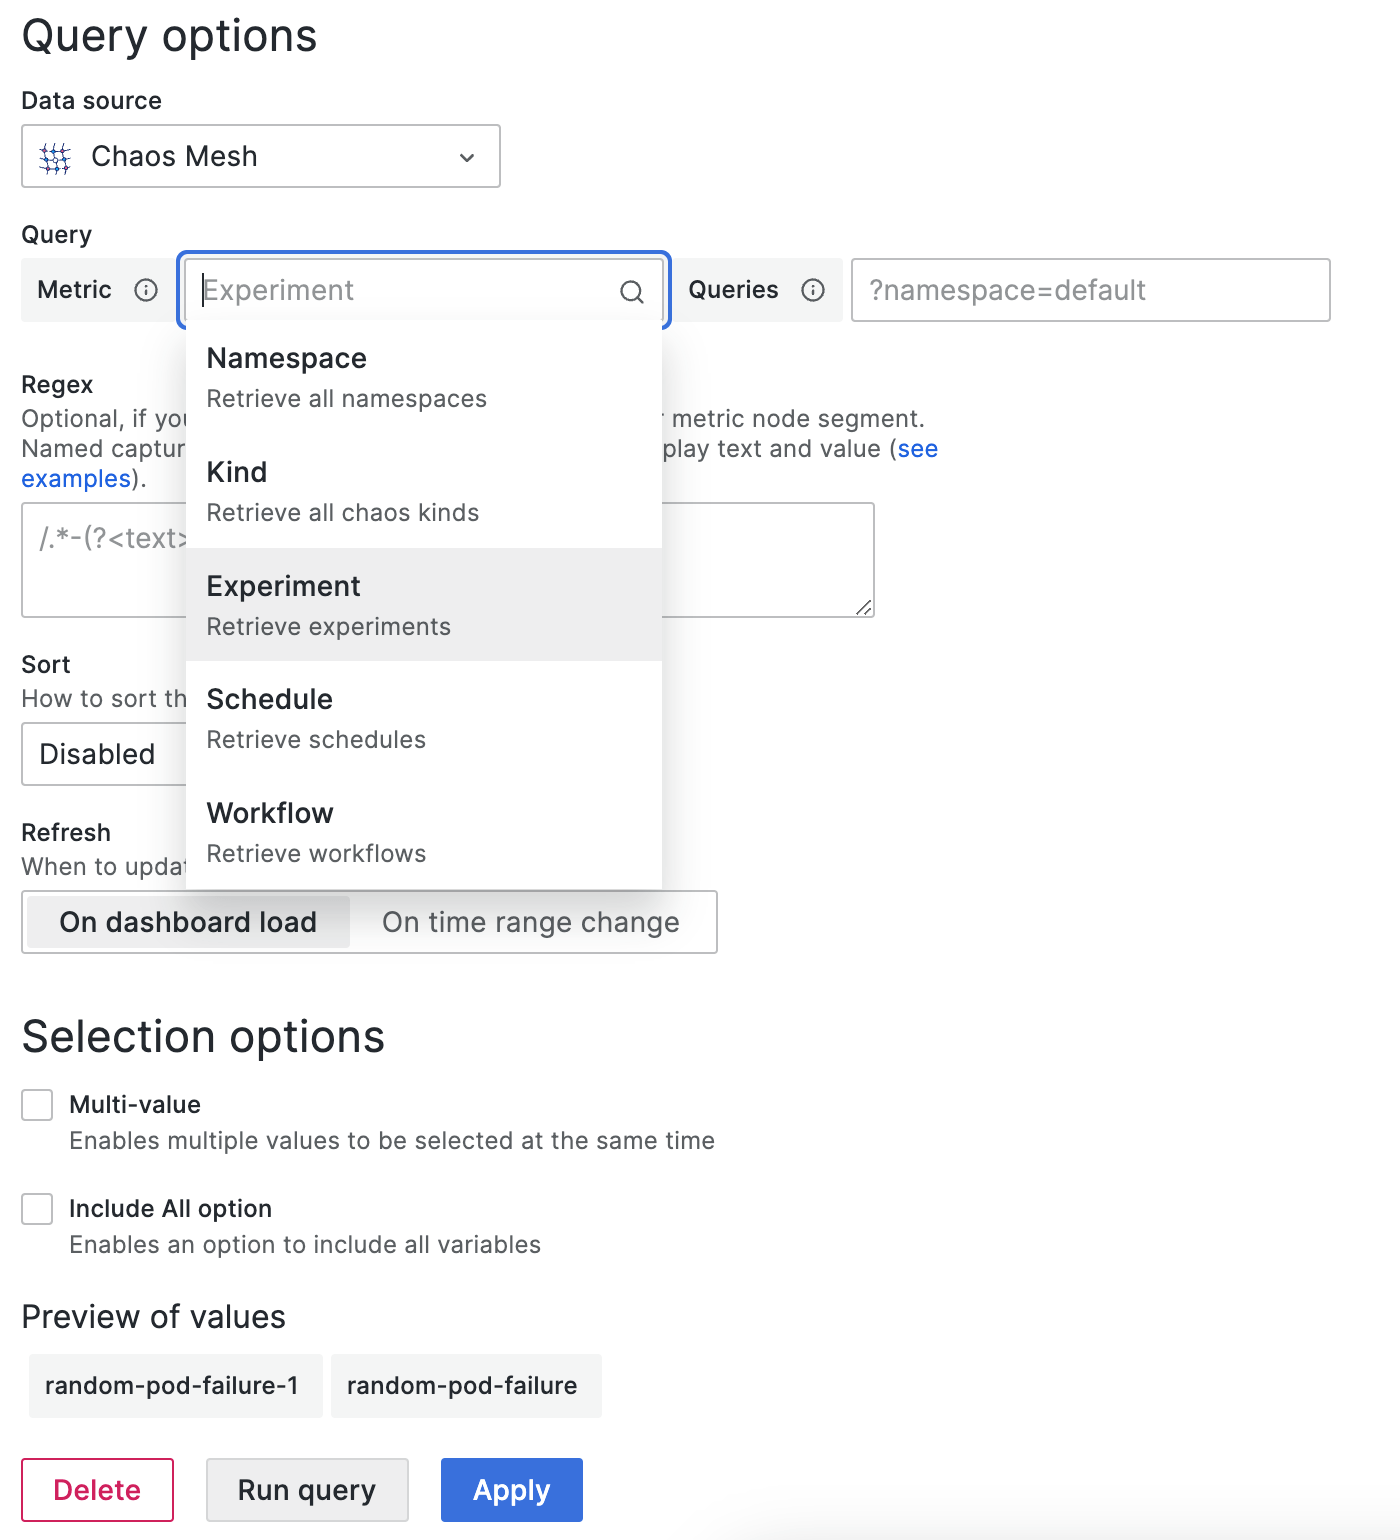
-
Namespace
After selection, all available namespaces will show in Preview of values directly. Without other operations.
-
Kind
Same as Namespace. Get all kinds.
-
Experiment
Same as Namespace. Get the names of all experiments.
-
Schedule
Same as Namespace. Get the names of all schedules.
Pull a request or open an issue to describe your changes or problems.
Same as Chaos Mesh. Under Apache-2.0 License.