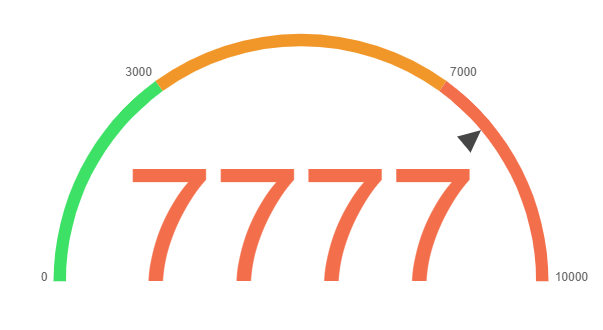
Extension for Chart.js that allows you to draw "Speedometer" graphs.
Requires Chart.js 2.7.0 or later.
<script src="Gauge.js"></script>var ctx = document.getElementById("canvas").getContext("2d");
new Chart(ctx, {
type: "tsgauge",
data: {
datasets: [{
backgroundColor: ["#0fdc63", "#fd9704", "#ff7143"],
borderWidth: 0,
gaugeData: {
value: 7777,
valueColor: "#ff7143"
},
gaugeLimits: [0, 3000, 7000, 10000]
}]
},
options: {
events: [],
showMarkers: true
}
});TSGauge is available under the MIT license.
