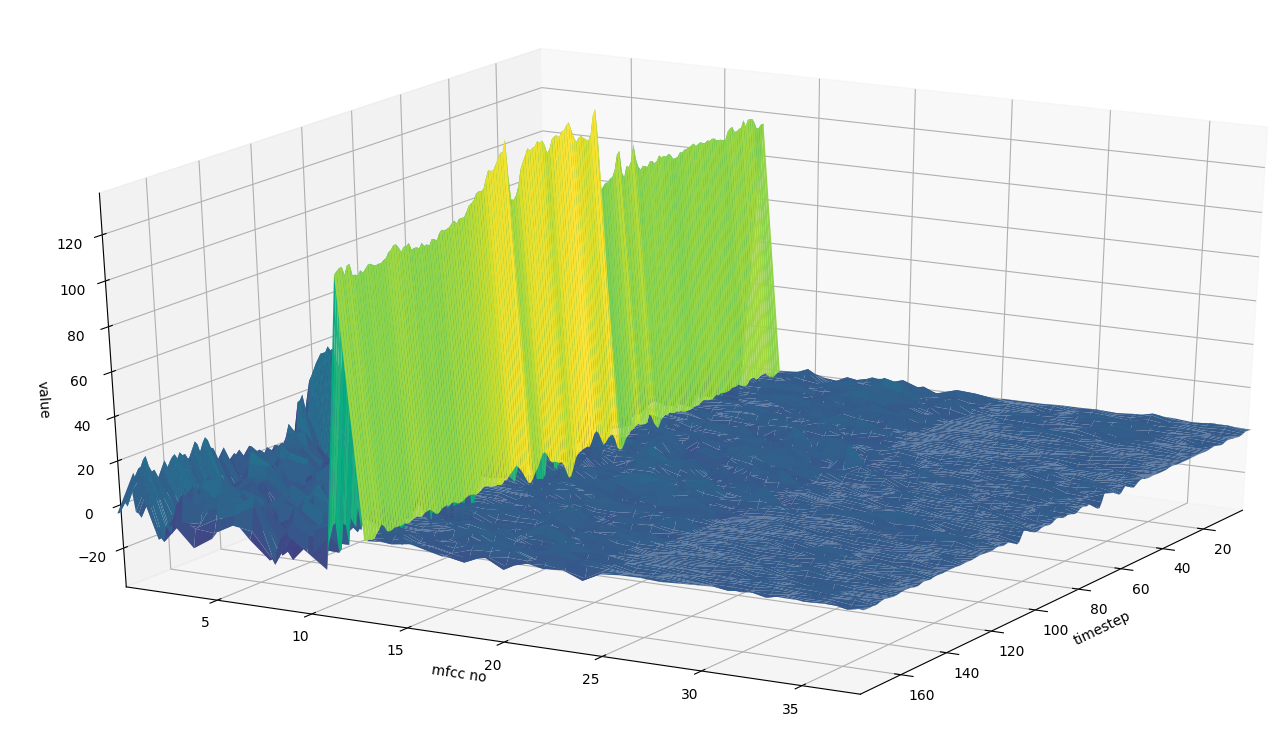
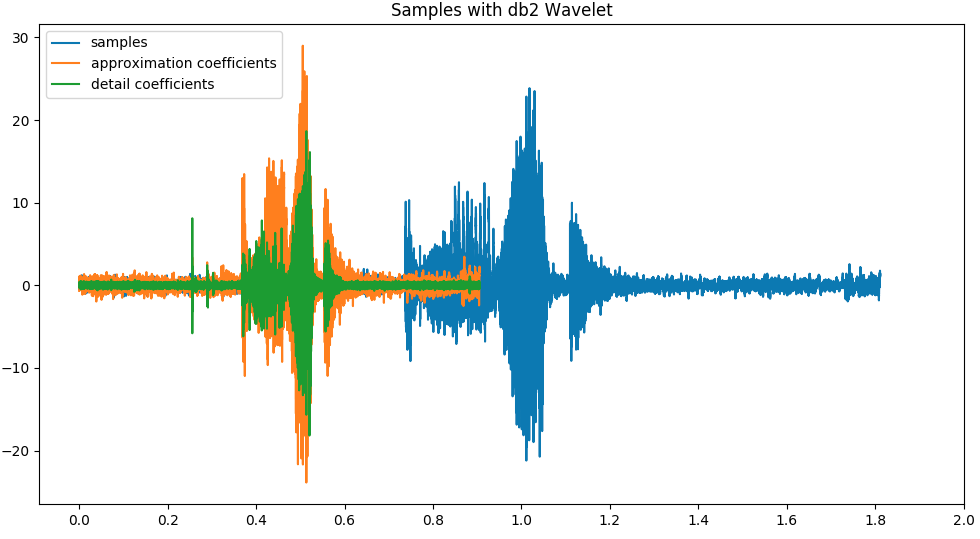
This script plots the samples from speech01.wav (50 times amplified). It's also plotting the MFCCs (including deltas and deltadeltas) (without amplification).
The MFCCs in outmfcc_D_A.csv were extracted with this command:
time SMILExtract -C config/MFCC12_0_D_A.conf -I speech01.wav -csvoutput outmfcc_D_A.csv
This config file is included with OpenSMILE.
The samples were extracted with sox:
sox speech01.wav -t dat out.txt
# csv-like
# sed -E wegen Mac OS
cat out.txt | sed -E -e 's/^ +//g' -e 's/  +/;/g' > samples.csv
Check out the code for visualising a 3D array in this commit. I couldn't find an easier solution anywhere else yet but I'm sure it CAN be done easier than this ...
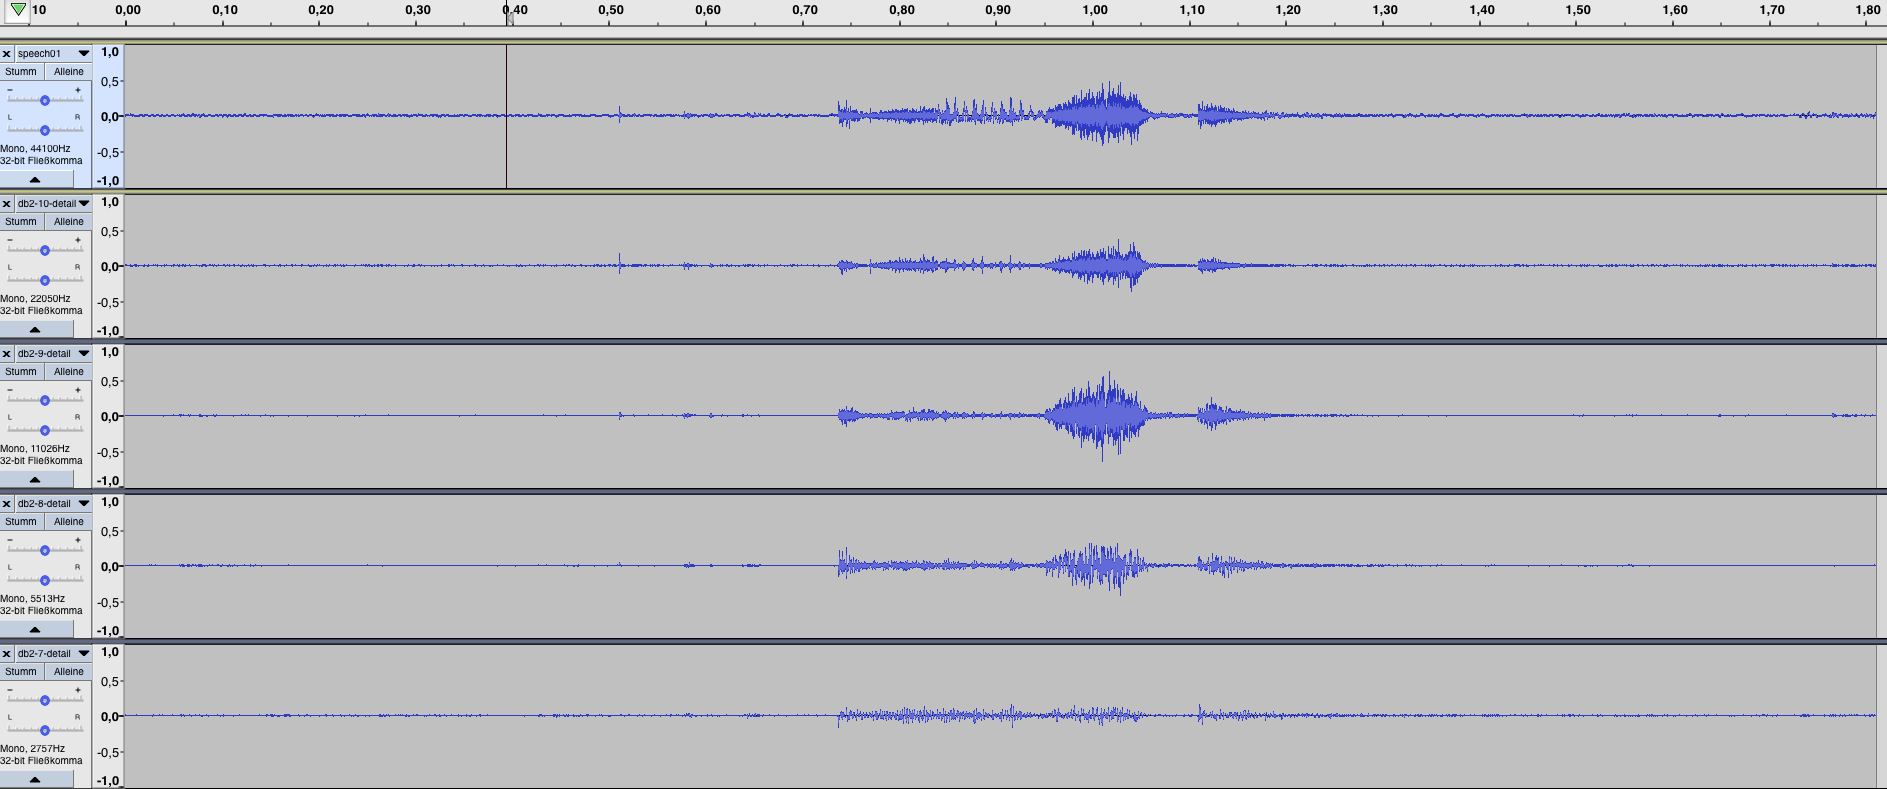
Wavelets are calculated with the pywt library.
Next step in understanding wavelets.


