Table of Contents
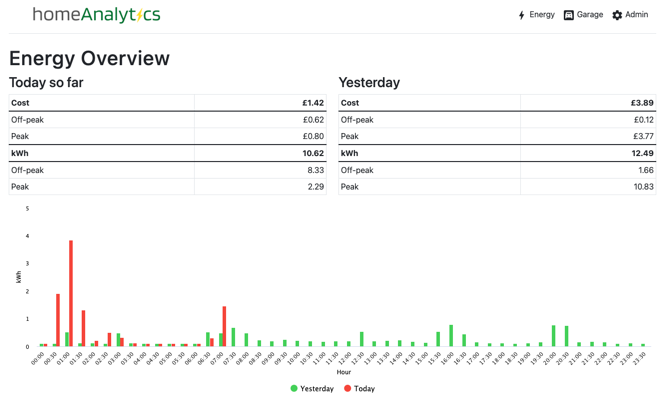
HomeAnalytics empowers you to understand and manage your home energy usage by presenting the data in a more usable, useful, and transparent way.
By leveraging existing APIs and freely available data, HomeAnalytics offers a low-cost or no-cost solution to track your electricity usage.
HomeAnalytics allows you to monitor your energy usage over time, identify trends, and access insights that are beyond the capabilities of standard smart meters.
Utilizing a home server, like a Raspberry Pi, you can set up an always-on display, providing you with a fully customizable, near real-time home energy monitor.
- View and analyse your energy usage over time
- Access in-day electricity usage and cost data (when used with n3rgy) at a half-hourly granularity
- Display accurate energy cost data, with support for off-peak tariffs such as Octopus Go
- Monitor and analyze your EV battery status, range, and mileage over time
- Use as a Raspberry Pi-powered energy monitor to replace or supplement your In-Home Display
To quickly try out HomeAnalytics, simply run the Docker Compose script with the following command:
docker-compose -f docker-compose.yml upThis will build two containers, one for the web UI and one for the data collection tasks. The SQLite database will be created using the path defined in the /.env file for the HA_DB_URL variable.
-
Navigate to http://localhost:3000/admin/list-tariffs and add in the details of your electricity tariff and rates.
-
Follow the steps below to set up your n3rgy API account. Enter the authorization header value as the value for auth_header` at http://localhost:3000/admin/view-entity?id=1
- Find your MPxN number (a 13-digit number found on your electricity bill) and note it down. If you need help finding it, UK Power Networks can help.
- Locate your IHD MAC address and note it down. This is usually on your smart meter device somewhere. Refer to this guide to help find it.
- Go to the n3rgy Consumer Site and enter your MPxN number and IHD MAC address
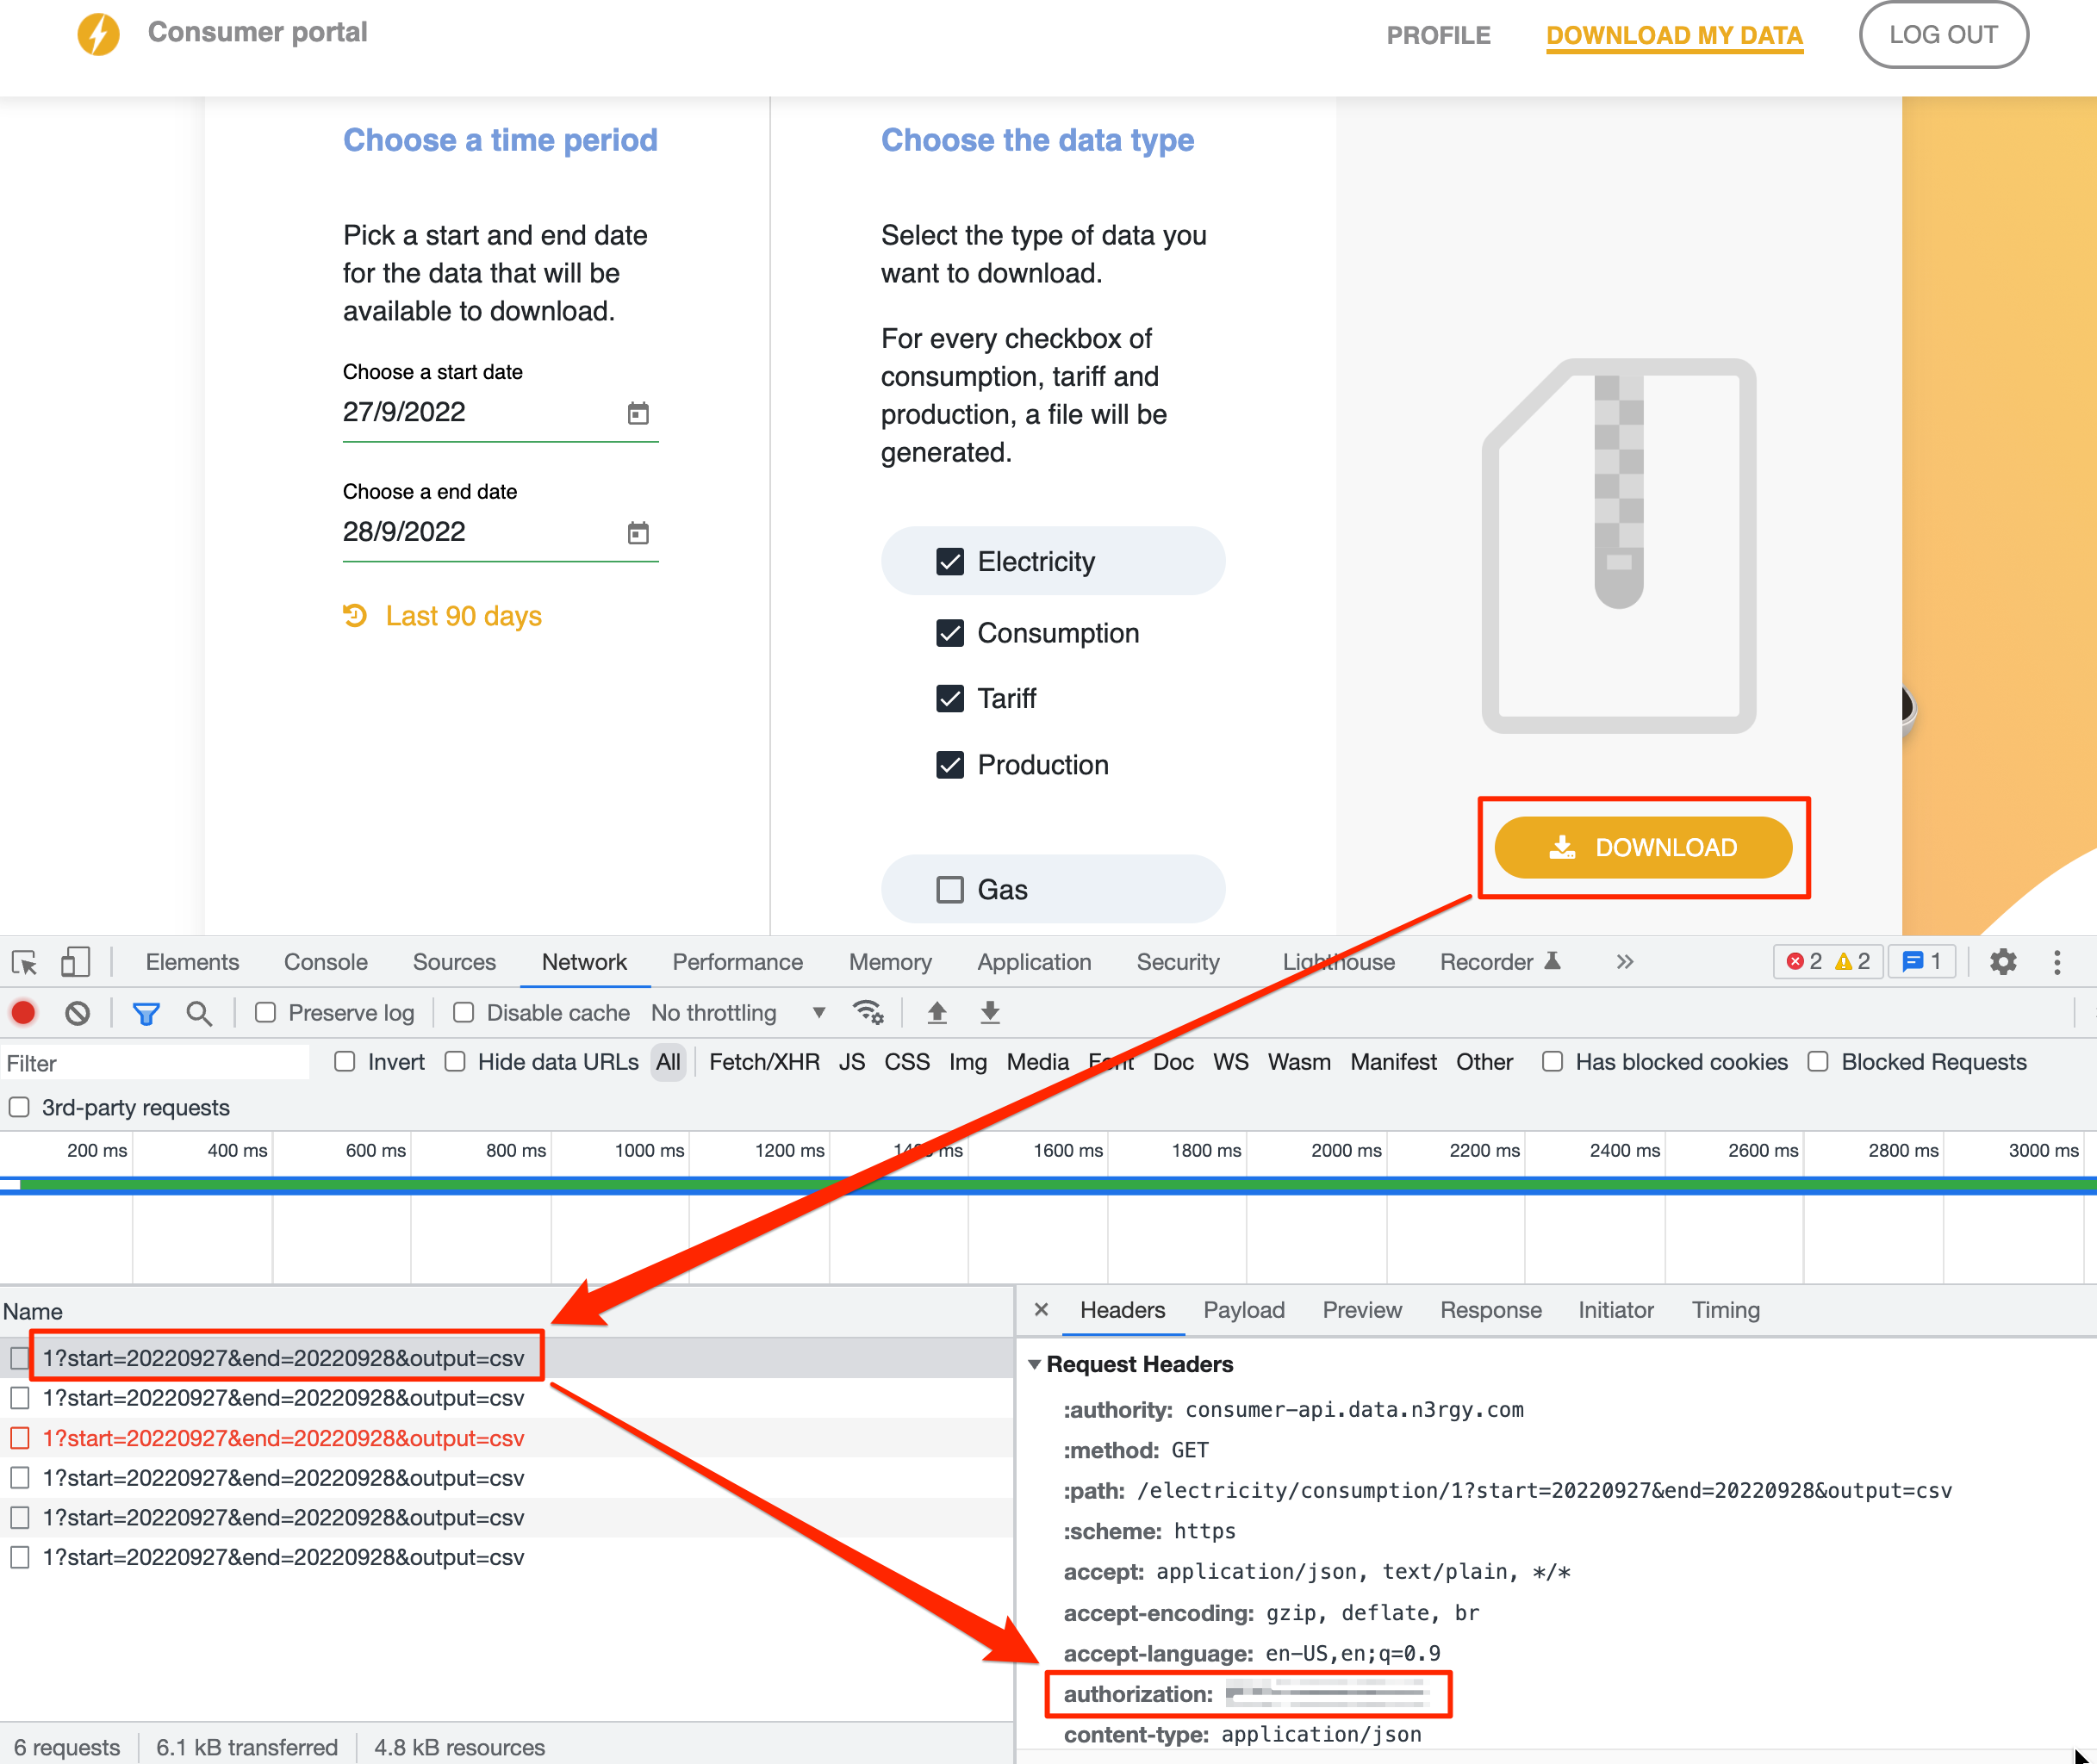
- Once you're logged in, click on the 'Download My Data' link, open up Chrome Dev Tools, click the 'Download' link, and find the value of the authorization request header as shown below:
Octopus is easier to set up but only offers data up to midnight the previous day.
You will need your MPAN, Serial Number and API key, which can be found in your Octopus dashboard, then update the dummy credentials you are provided with in the web UI on the first load of HomeAnalytics.
To install on Raspberry Pi, you need a 64bit OS, as Prisma.io does not support 32bit.
- Open the terminal on your Raspberry Pi and install the Github Client:
curl -fsSL https://cli.github.com/packages/githubcli-archive-keyring.gpg | sudo dd of=/usr/share/keyrings/githubcli-archive-keyring.gpg
sudo chmod go+r /usr/share/keyrings/githubcli-archive-keyring.gpg
echo "deb [arch=$(dpkg --print-architecture) signed-by=/usr/share/keyrings/githubcli-archive-keyring.gpg] https://cli.github.com/packages stable main" | sudo tee /etc/apt/sources.list.d/github-cli.list > /dev/null
sudo apt update
sudo apt install gh-
Clone this project into a suitable directory, ie
/var/www/homeanalytics -
Install Node.js:
curl -fsSL https://deb.nodesource.com/setup_18.x | sudo -E bash -
sudo apt-get install -y nodejs- Install Node.js dependencies:
cd /[PROJECT_PATH]/app/web
npm i-
Initialize the Prisma client by running
npx prisma generate -
Install Python dependencies:
cd /[PROJECT_PATH]/app/tasks
pip3 install -r ./requirements.txt- Set the DB path as an environment variable:
echo "export HA_DB_URL=/[PROJECT_PATH]/app/db/prod.db" >> ~/.profileThen restart your shell session so the env variable is loaded for the next steps.
-
Set up the cron tasks - adapt
example-crontab.txtto your project paths and copy the content into the crontab editor (crontab -e) -
Run the Web UI in the background using PM2
sudo npm install -g pm2
pm2 start "cd /[PROJECT_PATH]/app/web/; npm run dev"
pm2 save- You should now be able to access your installation on your local network at the Pi's IP address, for example
http://10.0.0.5:3000
If you want to connect your Pi to a display (as demonstrated here), you can set up Chrome to run in 'kiosk mode'. To do this, log into your Pi directly or via VNC (the Chrome command will fail via SSH), and launch the terminal window.
First of all, disable screensaver and power-saving settings:
sudo nano /etc/xdg/lxsession/LXDE/autostartComment out the line:
@xscreensaver -no-splash
And add these lines:
@xset s off
@xset -dpms
@xset s noblank
You may need to disable screen blanking in raspi-config too:
sudo raspi-configNavigate to Display Options, find Screen Blanking and turn it off. You will need to restart your Pi for changes to take effect.
Next, hide the cursor after a short period of inactivity so it doesn't show on the kiosk display:
sudo apt-get install unclutter
echo "@unclutter -idle 0.5" >> ~/.config/lxsession/LXDE/autostart
Finally run the following command from a VNC terminal window to launch a full screen instance of Chrome:
chromium-browser --noerrdialogs --disable-infobars --kiosk http://localhost:3000/pi &You can then safely exit the VNC session.
A small number of smart home integrations are available in the Python tasks folder, although it should be easy to build new ones.
To enable the integrations, uncomment the relevant lines in the crontab.
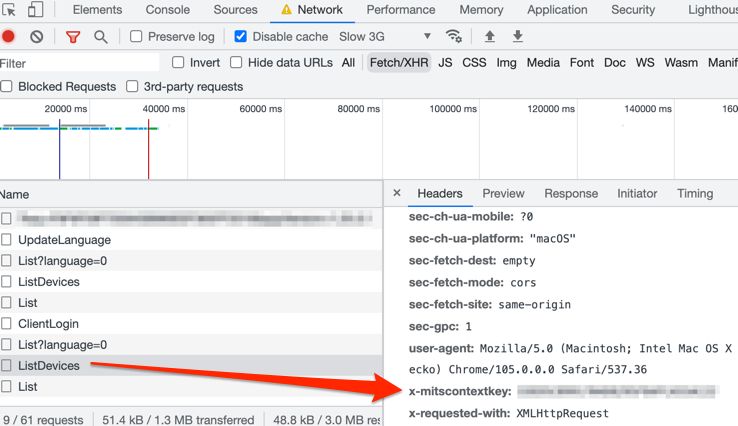
To add a Mitsubishi Ecodan heat pump, you need to examine the HTTP requests that the MelCloud web app sends to find your heat pump's device ID and the MITSI_CONTEXT_KEY.
For the MITSI_CONTEXT_KEY value, log in to the MelCloud app and inspect the value of the x-mitscontextkey:
For Device ID, inspect the response and look for DeviceID in Structure > Devices:
Then add an entity named 'Ecodan', with the following setup:
Next, enable the /app/tasks/melcloud.py script in the crontab.
To add hourly temperature data, add your 'location' number (found in the header request) as a credential, then enable the /app/tasks/melcloud-temperatures.py.
Tested on an E-Niro EV, however the integration should work for Kia cars, and possibly Hyundai vehicles (untested).
To set up a Kia vehicle, add its details in Admin > Garage (including VIN), then add an entity with your app login credentials as follows:
Then enable the /app/tasks/kia.py script in the crontab.
Tested on a Renault Zoe ZE40.
To set up a Renault vehicle, add its details in Admin > Garage, then add an entity with your app login credentials as follows:
Then enable the /app/tasks/renault.py script in the crontab.
Usage and cost data can be obtained if you have a Pod Point home charger. Tested on a Solo 1 model.
To set up, add an entity named 'Pod Point', and add your user credentials that you use to log into your app:
Then enable the /app/tasks/podpoint.py script in the crontab.
Note: This is an under-development feature so may change without notice.
Smart plugs that use the Tasmota software can publish energy usage data that can be consumed by homeAnalytics.
Step 1: Set up your MQTT broker. If you have one already set-up, you can skip this step.
If you're using a Raspberry Pi or similar, always-on server, you can follow these steps:
sudo apt update && sudo apt upgrade
sudo apt install -y mosquitto mosquitto-clients
sudo systemctl enable mosquitto.service

sudo nano /etc/mosquitto/mosquitto.conf
Then add the following lines to the bottom of the mosquitto.conf file:
listener 1883
allow_anonymous true
Next, restart the MQTT broker:
sudo systemctl restart mosquittoNote the local IP address of your server/Pi:
hostname -IStep 2: Configure your smart plug - go to your smart plug's IP address, and click Configuration -> Configure MQTT.
Then enter your MQTT Broker's Host IP, and rename the Topic to something easier to read:
The plug will now start publishing to the broker every 5 minutes.
Step 3
Add a .env file to the /app/tasks/ folder, containing the MQTT broker IP address, for example:
MQTT_BROKER=10.0.0.03
Step 4 Add the smart plug(s) as entities in homeAnalytics Admin area, setting the Entity Backend select box to 'Tasmota MQTT'.
Then add a credential with topic as the key, and the energy sensor as the value. This is generally in the format tele/your_device_topic/SENSOR, for instance:
tele/conservatory_heater/SENSOR
Step 5
Run the tasks/tasmota.py script in the background - it will continuously run and consume the data for all devices.
For example:
pm2 start "cd /[PROJECT_PATH]/app/tasks/; python3 tasmota.py"
pm2 saveYou can collect Carbon Intensity data for your postcode from CarbonIntensity.org, just add an entity called 'Carbon Intensity', with the credential key/value of postcode and the first segment of your postcode.
Then enable the /app/tasks/carbon_intensity.py script in the crontab.
- Add install script for Raspberry Pi
- Make onboarding for n3rgy easier
- Add authentication to access admin area
- Add web UI management of cron tasks
- Add Pi display screen management
- Add local weather forecast to Pi kiosk screen
- Add instructions/functionality for mDNS function
- Add guide to contributing new integrations
- Add entity usage estimates for entities that use a highly consistent amount of energy, that may already have been measured. For example a router is unlikely to vary much in its energy consumption.
- Add Changelog
- Tidy up Javascript for Pi screen
- Add more smart devices
See the open issues for a full list of proposed features (and known issues).
The core frameworks used in this project:
Contributions are what make the open source community such an amazing place to learn, inspire, and create. Any contributions you make are greatly appreciated.
If you have a suggestion that would make this better, please fork the repo and create a pull request. You can also simply open an issue with the tag "enhancement".
Don't forget to give the project a star! Thanks again!
- Fork the Project
- Create your Feature Branch (
git checkout -b feature/AmazingFeature) - Commit your Changes (
git commit -m 'Add some AmazingFeature') - Push to the Branch (
git push origin feature/AmazingFeature) - Open a Pull Request
Distributed under the MIT License. See LICENSE.txt for more information.
Rob Hammond - @robhammond - contact@rjh.am
Project Link: https://github.com/electric-sheep-energy/home-analytics
Some very useful projects that have helped make this tool possible:


