Creating a database with information about Campaign Funding and records of bills and votes in Congress to look at relationship between where members of congress get their funding and how they vote on relevent legislation.
I am interested in the ways in which information can be made more meaningful and accesible, and particularly about how technology can be used for that end. Having used databases in the past without truly understanding them, I wanted to explore the process of building and filling a database, and then taking that database and pulling some kind of meaning out of the information. With a casual interest both in politics and in the way that information about the political process is dissenimated, I decided to take Campaign Finance data and information about bills and votes and put them in a database together to see what kind of relationships exist between funding and votes that are not immediately apparent but which might give a better picture of what actually takes place in the legislative process.
I sourced my Campaign Finance data from OpenSecrets.org and the information on bills and votes from GovTrack.us. Knowing that the scope of what I wanted to accomplish might be out of the range of four weeks of work but that this is something I want to keep working on, I included financing data going back to 1994 and bill/vote data going back to 1999 to give myself the room to explore a larger base of information.
I wrote scripts to parse my data (written in Python to parse csv, json, xml, and yaml files) and used SQLAlchemy to fill my PostgreSQL database. To make the data meaningful and accesible, I built an app on top of it to allow exploration of some of the available information as well as some pre-determined points of interest to display.
- scripts for building and seeding the database are written in Python using SQLAlchemy as an ORM with PostgreSQL serving as the database engine
- visualizations use the d3js.org library (JavaScript)
- the webapp on top of the database uses Flask and Jinja for functionality and Bootstrap for design
Becaue the dataset is quite large, this repository contains all of the files needed to recreate the project exclusive of the actual data that seeds the database. The rsync_commands.py file contains a script for generating rsync requests for downloading bill and vote data from GovTrack.us, all Campaign Finance records can be downloaded from on OpenSecrets.org, and additional files from GovTrack (legislators-current.yaml, legislators-historical.yaml, legislators-current.csv) can be found here. The CRP IDs file (used for interpreting the Campaign Finance coding) can be downloaded from OpenSecrets here.
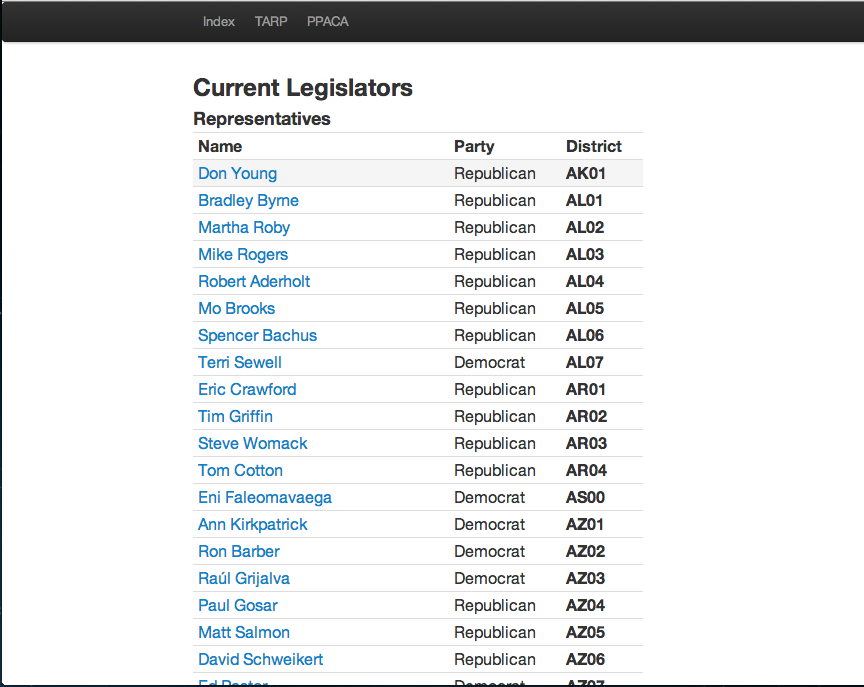
In it's current state as a locally-hosted webapp, users can select from a list of all current members of congress
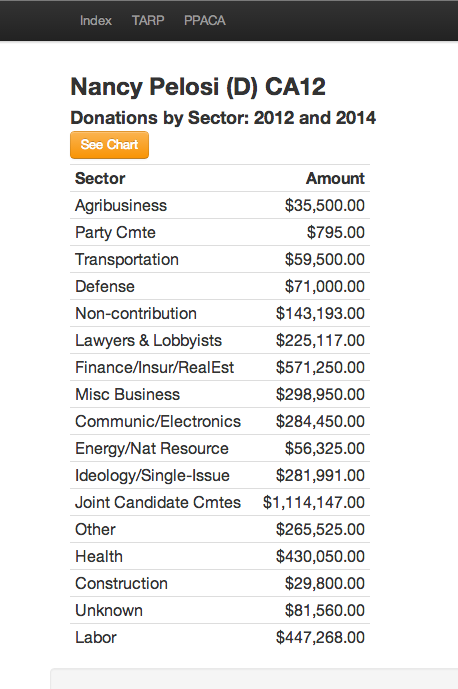
 to access 2012 and 2014 donation information by sector as a table
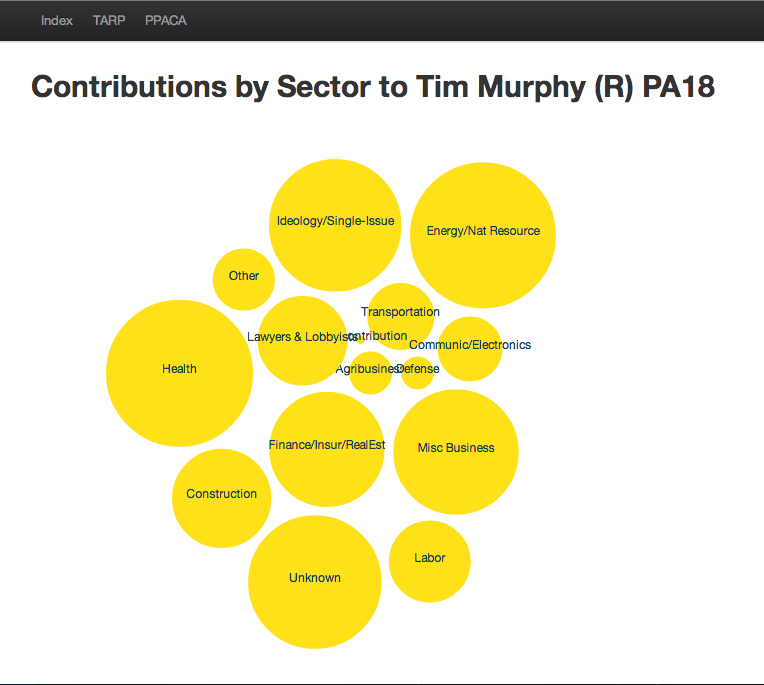
or visualized as a bubble chart.
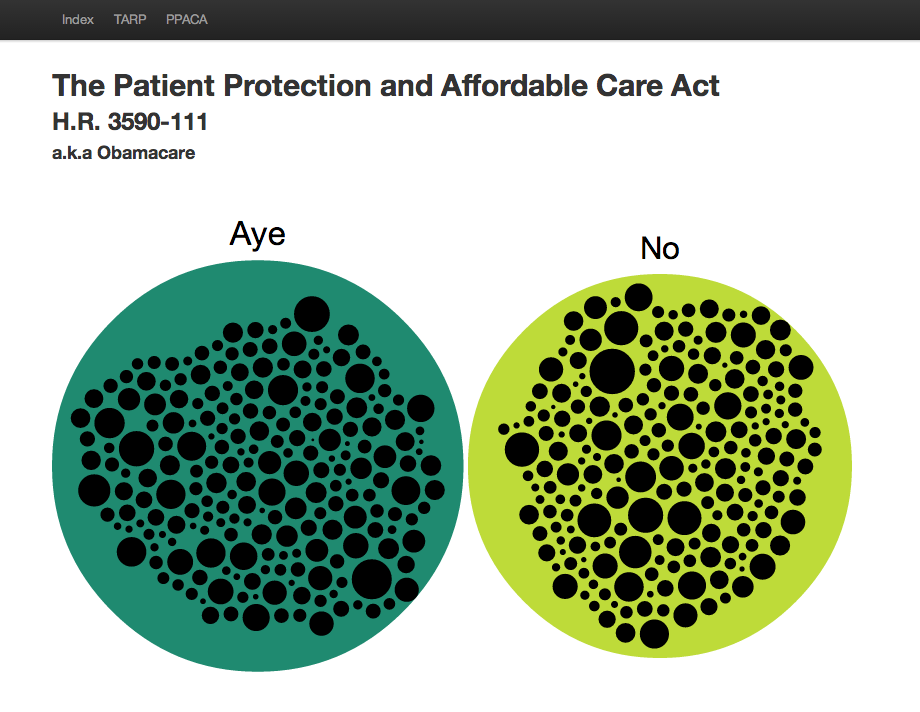
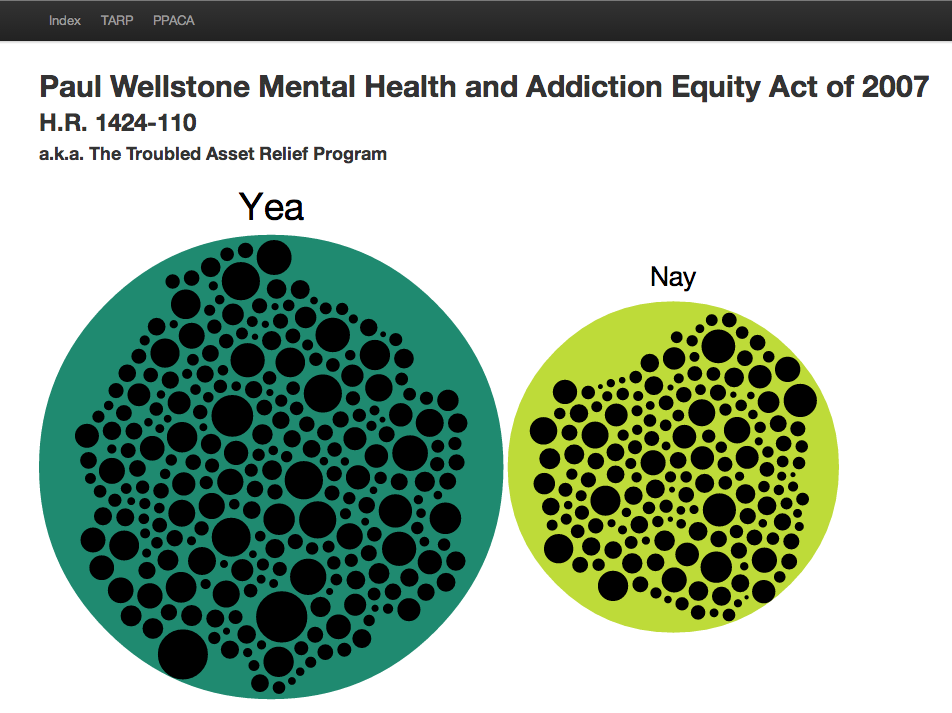
 Additionally, visualizations for selected bills (The Patient Protection and Affordable Care Act (2010) and the Troubled Asset Relief Program (2008)) show votes for and against each bill in the House of Representatives with the size of each legislator's bubble representative of contributions received from relevent sectors (Health in the case of PPACA, Finance in the case of TARP).
Bubble visualization for the Patient Protection and Affordable Care Act
Bubble visualization for the Troubled Asset Relief Program
- easier access for searching for a particular member of congress
- active links between visualized data and addtional information (i.e. when looking at an individuals legislator's funding a link on the Health bubble to his/her votes on bills about Health)
- links to more information about bills being referenced for greater context
- recreating/restructuring the database for greater functionality and speed, feeding relevent information into a graph database to produce additional visualizations of the data
- expanding the vote-funding visualization to include all available bills and votes
- pulling data across all legislators to determine if/how campagin funding can be used to predict future voting patterns (i.e. a decision tree that shows that X amount of dollars will lead with some certainty to a particular voting pattern when the bill is in regards to a particular topic)
- determining what other meaning can be pulled from the aggregated data using statistical anaylsis--k-means, pearson correlations, etc.