Server simulation for monitoring remaining useful life of turbofan jet engines
To demonstrate the working of proposed models in a real-time environment of https://github.com/ritu-thombre99/RUL-Prediction, we developed a website to simulate the server that can monitor the health of the engines as follows:
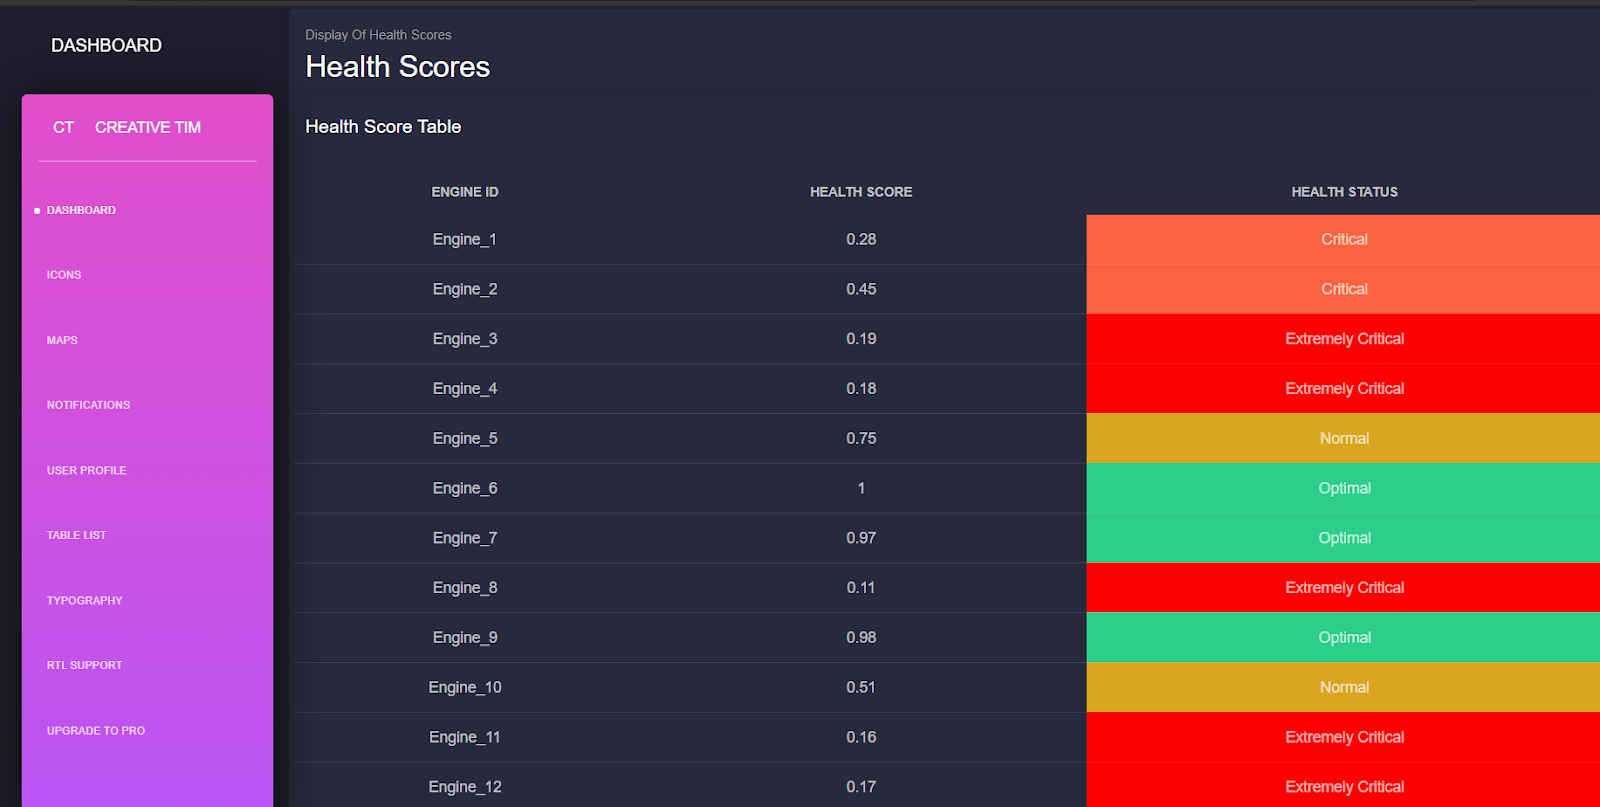
- After the simulation is started, health scores of 20 engines are displayed in a table
- Health of an engine falls under four categories:
- Extremely Critical (0-0.25)
- Critical (0.25-0.5)
- Normal (0.5-0.75)
- Optimal (0.75-1)
- Statistics of health and range of health scores of engines is displayed as a pie chart and a line graph
- Health scores of engines are refreshed every 1-2 second
- We used flask for the web development.
- All the models (regression and LSTM) are saved using pickle and save_model.
- These models are imported in the backend app.py file.
- VAR forecasts time-series of the randomly chosen 20 engines for 20 cycles into the future.
- LSTM with lookback=1 then predicts RUL for these 20 cycles and the corresponding health score is calculated.
- These health scores are then sent one cycle at a time to monitor.html file.
- We have 3 html files: home.html, monitor.html and finish.html.
- home.html will let a user to start the simulation and redirects to monitor.html.
- Once the simulation ends, monitor.html redirects to finish.html, from where user can restart the simulation.
- monitor.html file receives the health scores of 20 engines one cycle at a time from the backend.
- These health scores are displayed in a table as shown in the following figure
 .
. - Range of health scores and categories are generated using jinja2 and they are
displayed in a bar chart and a pie chart respectively, using google
visualization tools as shown in the following figure
 .
.