Springboot Application Monitoring using SpringbootAdmin Dashboard, Springboot with Prometheus and Grafana Dashboard, Elastic-Logstash-Kibana Dashboard
- Create Springboot application with Spring - Web,Actuator Dependencies.
- Start Springboot application default port 8080
- Verify Actuator endpoint
- Default "Health" endpoint will be enable
- Enable all supported endpoints by actuator using application.properties - management.endpoints.web.exposure.include=*
- Follow step:3
- All 13 endpoint will be enable.
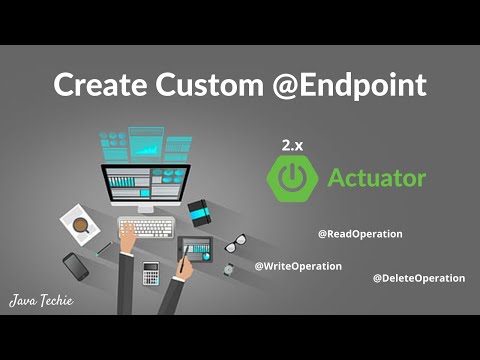
- Create Custom Actuator Endpoint.
- Follow step:2 , step:3
// Prometheus & Grafana 10. Add Prometheus dependencies in Springboot project. 11. Follow step:2 , step:3 12. Verify Actuator Prometheus Endpoint - http://localhost:8080/actuator/prometheus
Download Links:
- https://prometheus.io/download/
- https://grafana.com/grafana/download?edition=enterprise&platform=windows
Prometheus Dashboard:
- Learning: https://www.javadevjournal.com/spring-boot/spring-boot-actuator-with-prometheus/
- Base-Path: http://localhost:9090
Grafana Dashboard:
- Learning: https://www.youtube.com/watch?v=gJZhdEJvZmc&t=595s
- Base-Path: http://localhost:3000

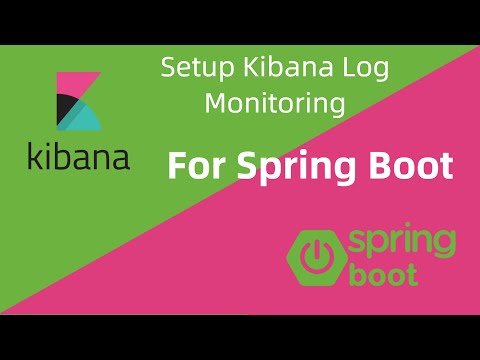
Elastic - Logstash - Kibana Dashboard
- Learning: https://www.youtube.com/watch?v=okYwBHGy5hU&list=PLHG8gv7LJNH3X8q8allExHjHIgOLQ2IOJ&index=3
- Download: https://www.elastic.co/downloads/
- Elasticsearch Base-Path: http://localhost:9200/
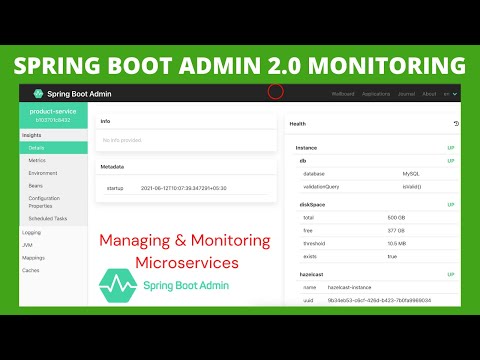
Springboot Admin Dashboard
- Learning:
- Admin Dashboard: http://localhost:8081