


![]()
Dephpugger (read depugger) is an open source lib to make a debug in php direct in terminal, without necessary configure an IDE. The dephpugger run in Php Built in Server using another command. You can use for:
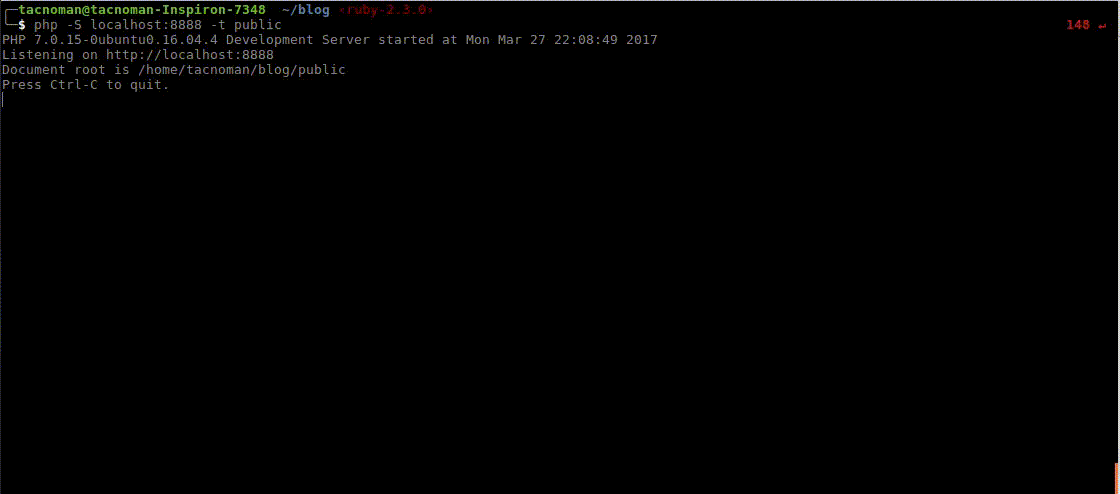
Image 1.0 - Screenrecord for debug web
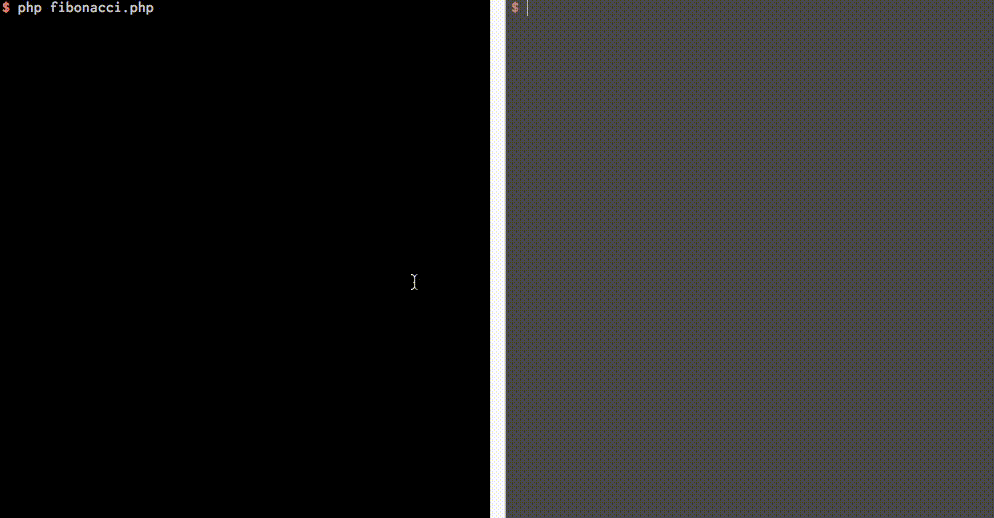
Image 1.1 - Screenrecord for debug cli scripts

To install you must run this code (using the composer).
$ composer require tacnoman/dephpuggerRun this command:
$ composer global require tacnoman/dephpuggerAnd add in your ~/.bash_profile.
export PATH=$PATH:$HOME/.composer/vendor/bin
Now run source ~/.bash_profile and you can run the commands using only $ dephpugger.
- PHP 7.0 or more (not tested in older versions)
- Xdebug activate
- A Plugin for your browser (If you want to debug a web application)
You can run this commands to check your dependencies:
$ vendor/bin/dephpugger requirements
$ vendor/bin/dephpugger info # To get all values setted in xDebug

# Or in global

$ dephpugger requirements
$ dephpugger infoTo usage you must (after installation) run two binaries in vendor/bin folder.
$ php vendor/bin/dephpugger debugger # Debugger waiting debug
$ php vendor/bin/dephpugger server   # Server running in port 8888

# Or in global

$ dephpugger debugger
$ dephpugger server
You must run in two different tabs (in next version you'll can run in an uniq tab). After run theese commands, you need to put the follow line in your code:
<?php
# ...
xdebug_break(); # This code is a breakpoint like ipdb in Python and Byebug in Ruby
# ....
Now, you can open in your browser the page (localhost:8888/[yourPage.php]). When you request this page your terminal will start in breakpoint (like the image 1.0).
To debugger a php script, you could run:
$ php vendor/bin/dephpugger cli myJob.php

# Or in global

$ dephpugger cli myJob.phpWhen you stop in a breakpoint you can make theese commands:
| Command | Alias | Explanation |
|---|---|---|
| next | n | To run a step over in code |
| step | s | To run a step into in code |
| set <cmd>:<value> | Change verboseMode or lineOffset in runtime | |
| continue | c | To continue script until found another breakpoint or finish the code |
| list | l | Show next lines in script |
| list-previous | lp | Show previous lines in script |
| help | h | Show help instructions |
| $variable | Get a value from a variable | |
| $variable = 33 | Set a variable | |
| my_function() | Call a function | |
| dbgp(<command>) | To run a command in dbgp | |
| quit | q | Exit the debugger |
The Dephpugger project has default options like a port, host, socket port, etc. You can change this values adding a file .dephpugger.yml in root directory project.
You can create in your .dephpugger.yml file the configurations. Like this:
---
debugger:
  host: mysocket.dev # default: localhost
  port: 9002 # default: 9005
  lineOffset: 10 # default: 6
  verboseMode: false # default: false
  historyFile: ~/.dephpugger_history # default: .dephpugger_history
server:
  host: myproject.dev # default: localhost
  port: 8080 # default: 8888
  path: ./public/ # default: null
  file: index.php # default: null
Theese values will replace the default configuration.
To see the full documentation click here.
The documentation to use, click here.
$ phpunitSend me an email or open an issue:
Renato Cassino - Tacnoman - <renatocassino@gmail.com>