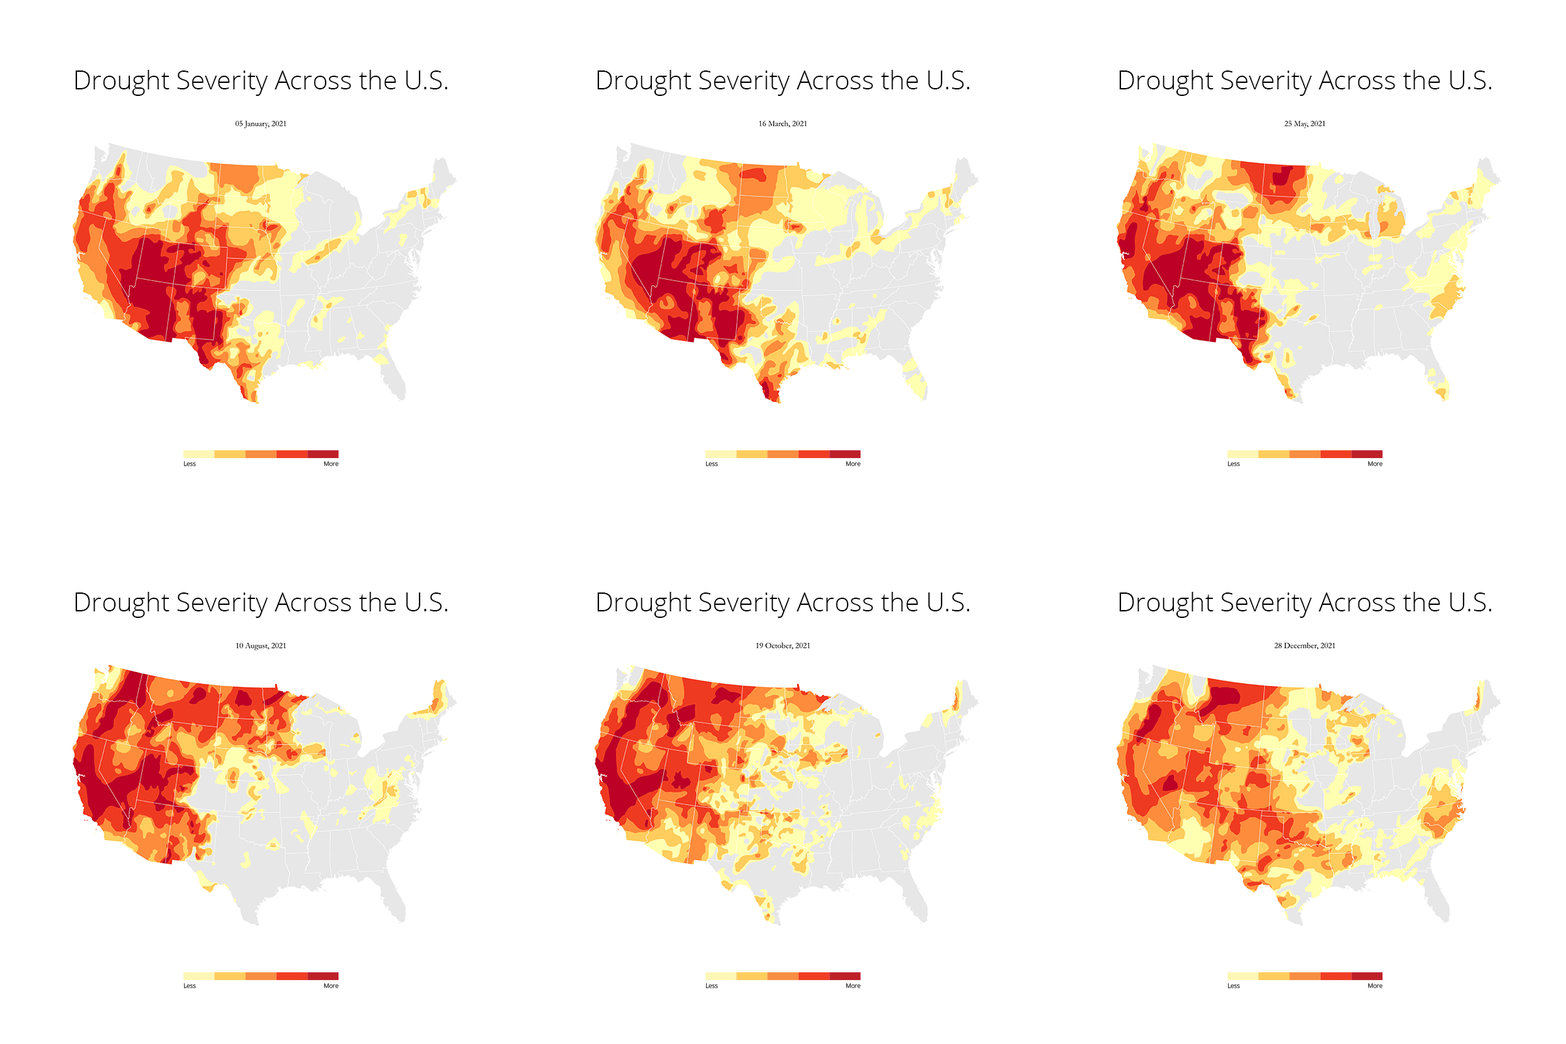
This repository includes all my notebooks and data from U.S. Drought Monitor that I used to visualize Spread of Drought in U.S.
To get started, clone this repository with git clone https://github.com/rezw4n/Drought-Monitor.git
cd Drought-Monitor
Geopandas, Pandas and Matplotlib library is required to run the notebook.
I would suggest to use a new conda environment and install the libraries as Geopandas comes with a lot of dependencies that throws error if you try to install with pip. To do this, first open your anaconda prompt and then:
Create a new environment:
conda create --name "Name of your environment"
Activate your environment:
conda activate "Name of your environment"
Install the packages:
conda install --channel conda-forge geopandas //This should install all the required packages including gdal, matplotlib, pandas etc.
conda install -c conda-forge jupyterlab // For installing Jupyter Lab
Now just open a Jupyter Lab instance with jupyter lab in the anaconda prompt and play around with the notebook.
Later I combined all the plots into a gif file with the Pillow library, added title and legend.
