The task is to classify a given time-series into one of 8 classes, i.e., 8 different gestures. There are two aspects of this challenge: model building (from scratch and using libraries) and gathering some assumption/ideas towards making the model as a ML software to be deployed in production environment.
- T1.1: Use Python and NumPy for all aspects of the "data science workflow" data preprocessing/feature extraction/ML-training/ML_test" (a few exceptions below)
- T1.2: Please implement and train a logistic regression model by hand (plain numpy)
- T1.3: If you want to use other ML-models (neural networks, support vector machines), feel free to use existing libraries (don't invest too much time here)
- T1.4: You can/should use libraries for visualizing the results (whatever you feel makes sense to visualize).
I downloaded the dataset from this link. This dataset is part of the paper "uWave: Accelerometer-based personalized gesture recognition and its applications" by Jiayang Liu et al. (see more at https://www.yecl.org/publications/liu09percom.pdf). Unpacking the data, leaves several '.rar' files, having the following meanings:
- Each .rar file includes gesture samples collected from one user on one day. The .rar files are named as U$userIndex ($dayIndex).rar, where $userIndex is the index of the participant from 1 to 8, and $dayIndex is the index of the day from 1 to 7.
- Inside each .rar file, there are .txt files recording the time series of acceleration of each gesture. The .txt files are named as [somePrefix]$gestureIndex-$repeatIndex.txt, where $gestureIndex is the index of the gesture as in the 8-gesture vocabulary, and $repeatIndex is the index of the repetition of the same gesture pattern from 1 to 10.
- In each .txt file, the first column is the x-axis acceleration, the second y-axis acceleration, and the third z-axis acceleration. The unit of the acceleration data is G (i.e., acceleration of gravity).
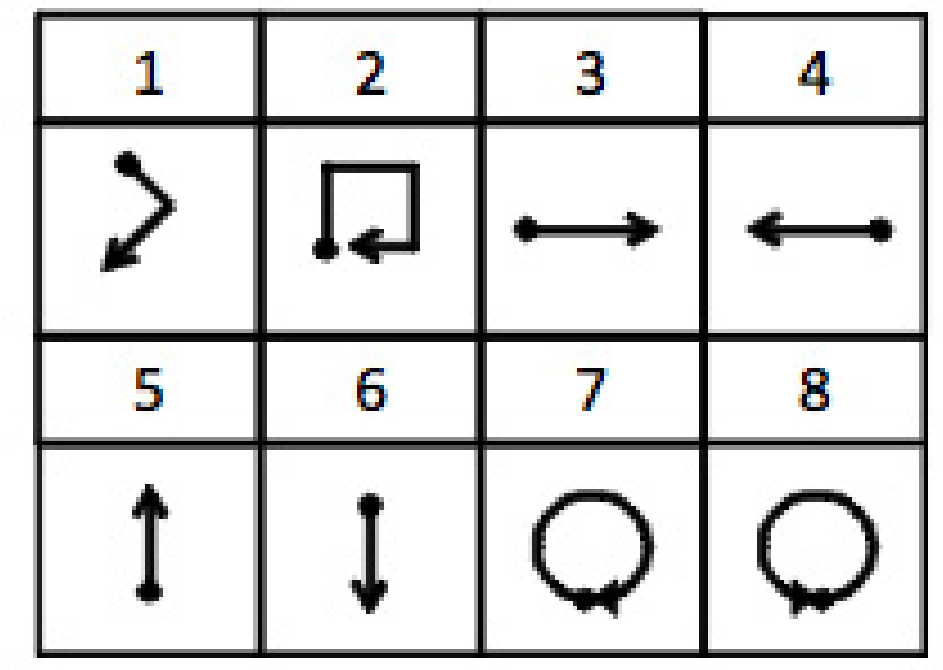
In the above picture, 8 different types of gestures are shown, where the dot denotes the start and the arrow denotes the end of a gesture.
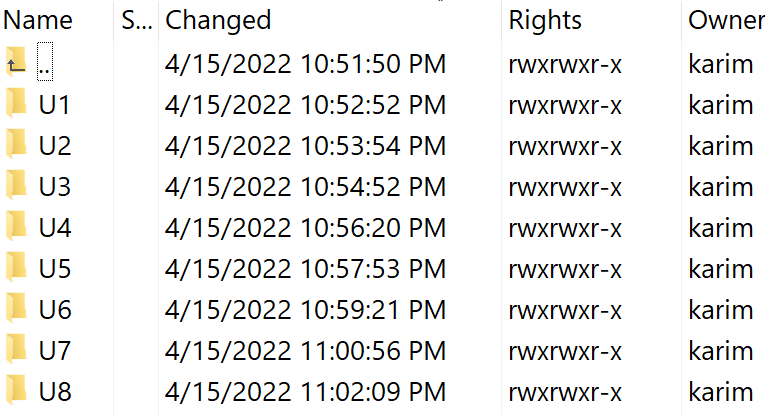
The dataset had some unwanted files too, e.g., '1.txt' containing information such as "4-9: precision (11), sample frequency (100)". However, according to above description, such files are unnecessary. Therefore, I removed all the files except for the ones designated with "[somePrefix]repeatIndex.txt". Besides, I had to do some manual way of restructuring the folders across 8 different gesture vocabularies, gesture 1, ...., gesture 8, etc. My bad, perhaps that could be done in a more efficient ways. Even, I wrote another script for downloading and feature extraction from the '.rar' files. Please refer to naive_data_prep.py for more detail. After restructuring and removing unnecessary files, I created another '.zip' file where folders are structured as follows:
First, I implemented and trained a baseline logistic regression (LR) model on the feature extracted, which I evaluated on the test set w.r.t performance metrics, confusion matrix, and class-wise classification reports. Then, I compare the baseline LR model with the sklearn-based LR model as well as a well-studied TimeSeriesForestClassifier from the SKTIME library. I'm really not expecting the baseline LR model to perform well because LR is ideally not suitable for the time series classification task.
I wrote a script named data_util.py in NumPy to extract features from the '.txt' files. There are 3 methods in this script:
- extract_gesture: it takes the path of respective users gestures and returns a list of accelerations across all x-, y-, and z-axes.
- create_dataset: it takes a set of gestures as input and generates a time series with labels for each sample. More technically, it creates a time series data by stacking the acceleration (across 3-axes) samples of all the gestures (total 4,480 samples) side-by-side, such that: i) the dimension of each sample is (n_samples, 3 * n_features) = (4480, 942), where the number of features = 314 * 3 = 942 and the nmber of n_samples = len(gesture) * 8 = 560 * 8 = 4480.
- getFeatureSKTime: this function is used to extract features using the sktime library. It takes the paths of training and test '.ts' files and returns the array of features and labels (X, y).
A simple baseline LR has been implemented in NumPy in the lr.py script. The algorithm has several components:
- Softmax activation function: It takes z (product of features with weights) and generate probbality distribution over the classes -> based on which the predictions will be made. In fact, this makes the logistic regression different from linear regression.
- Cost function: Cross-entropy between two probability distributions of y and y_pred
- Random initialization of parameters: The parameters 'w' and 'b' are randomly initialized with 0 to start with (w vector has the shape (945, 1)), whereas the values will be updated using the optimization function. Then the cross-entropy cost function is optimized to minimize the cost during the backprop.
- Forward propagation and optimization: Using gradients descent algorithm, gradients of 'w' and 'b' parameters are computed and updated, as follows: w := w - lr * dw; b := b - lr * db. Thus, looping over for n_iter, we hope to reach a convergence point where the cost function won't decrease any further.
   $ git clone https://github.com/rezacsedu/Celonis_DS_Task.git
   $ cd data/
   $ unzip UWaveGestureLibraryAll.zip
Then from within the 'Celonis_DS_Task' directory, run the following from command line:
$ python main.py
It will show the results on console. Besides, the convergence of the training losses for the NumPy based logistic regression will be generated in the 'imgs' folder with the 'training_loss.png' file name.
A supporting notebook Classification_with_manual_FE.ipynb is provided, which shows how the baseline LR model works compared to other classifiers (e.g., LR in sklearn and TimeSeriesForestClassifier from the SKTIME library). In particular, my baseline LR model yields an accuracy of 54%, underperforming the sklearn-based LR and sktime-based TimeSeriesForestClassifier that yielded an accuracy of 69% and 90%, respectively.
On the other hand, the baseline LR classifier clearly outperforms itself when it was trained on features extracted with the sktime library. In particular, the baseline LR model this time yields an accuracy of 84%, outperforming the sklearn-based LR model that yielded an accuracy of 81%. On the other hand, the sktime-based TimeSeriesForestClassifier that yielded an accuracy of 97%. Please refer to supporting notebook Classification_with_SKTIME_FE.ipynb. This signifies that feature engineering can have a significant impact on the performance of individual models.
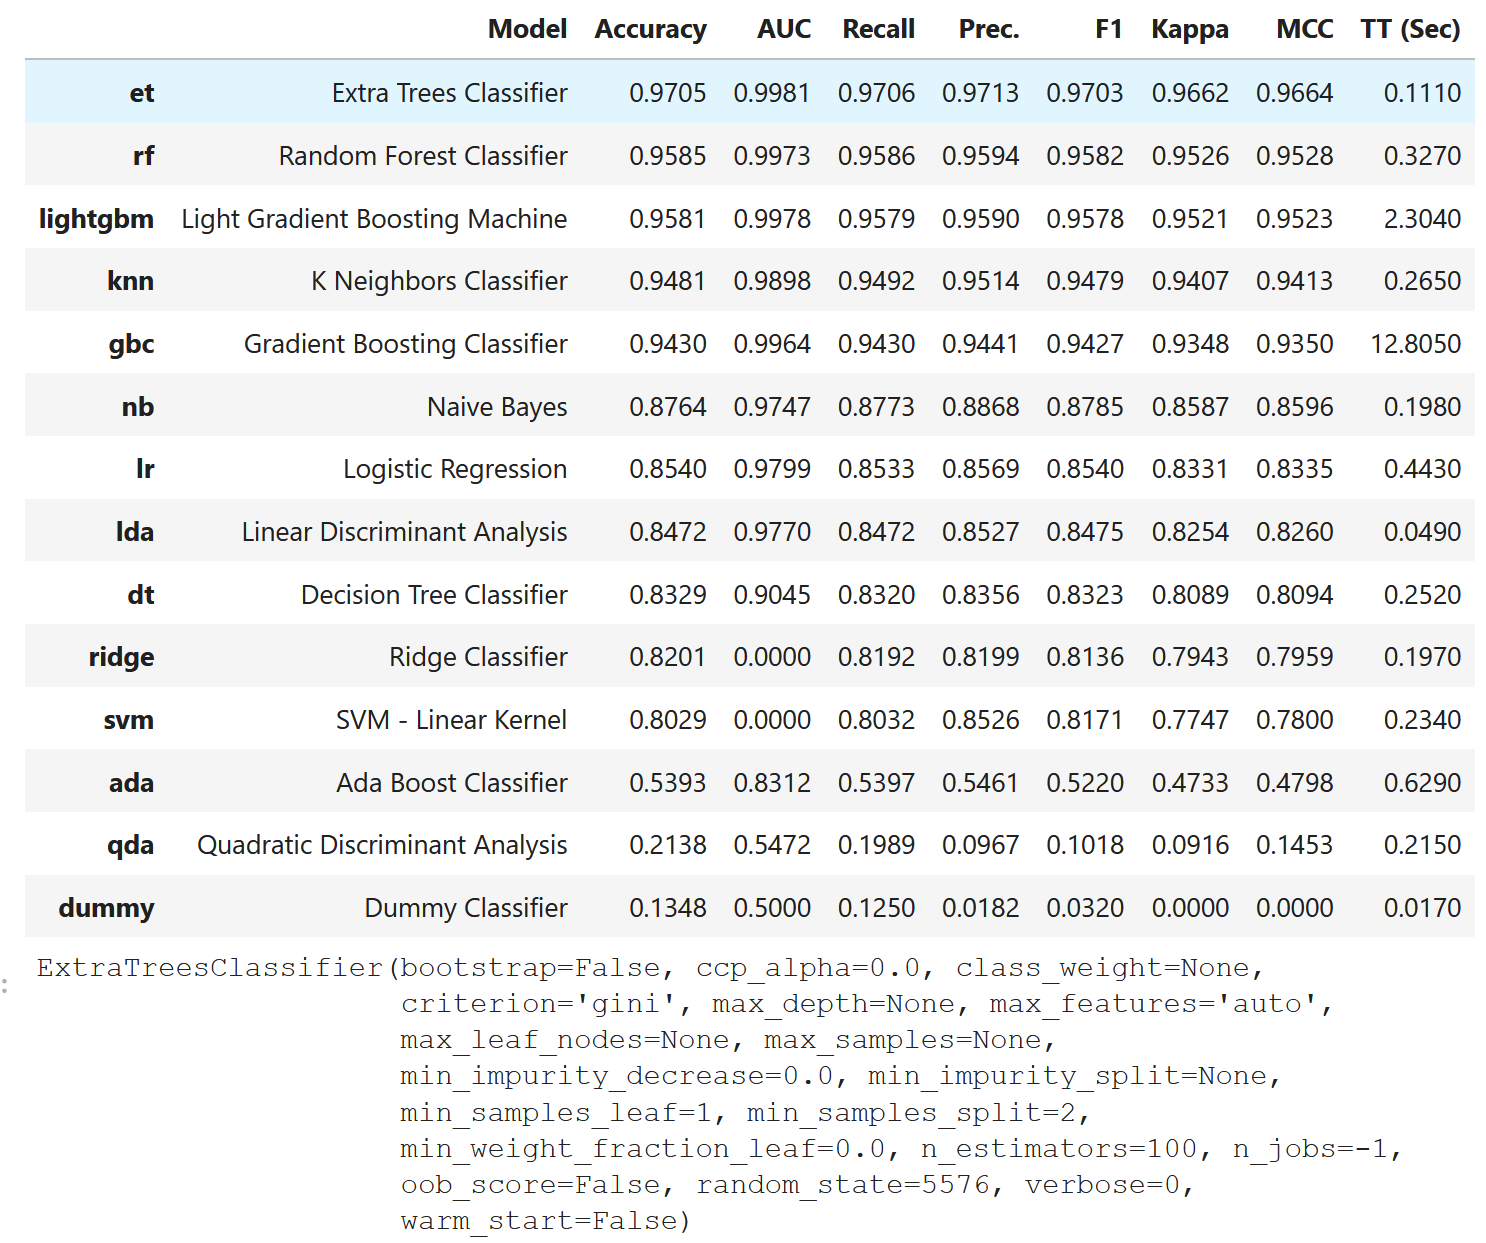
I tried with PyCaret - one of my favorite AutoML libraries. The extra tree and random forest classifiers turns to be the best models for this dataset, yielding f1 scores of over 97%, even outperforming the result reported in the original paper by 1%! To justify this, I prepared a supporting notebook PyCaret_with_FE_SKTIME.ipynb.
To give the quick impression, let's see how different classifiers performed on the data:
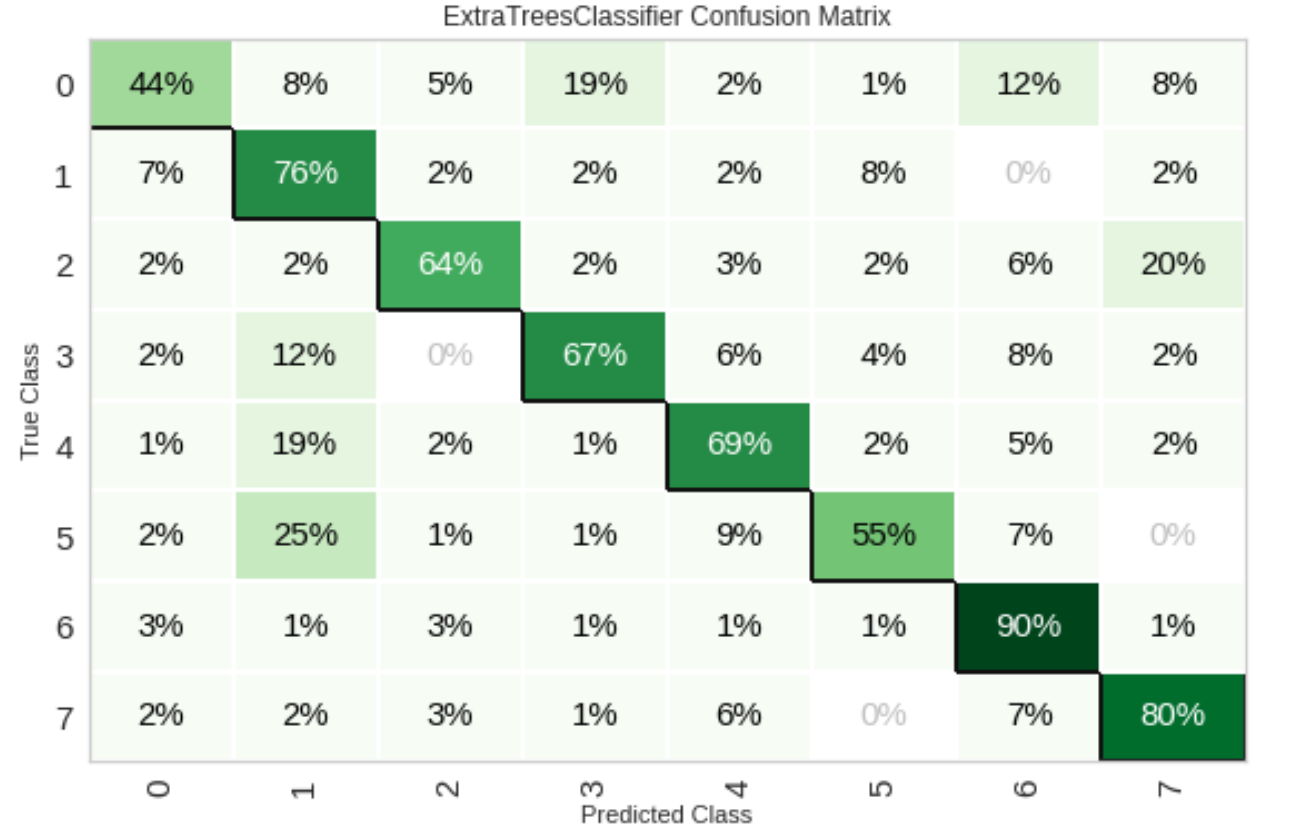
Let's see how extra tree classifier performed across different gesture types in the froms of confusion matrix:
As we can see, it mostly made correct predictions and was less confused among classes. Further, we plot the ROC curve:
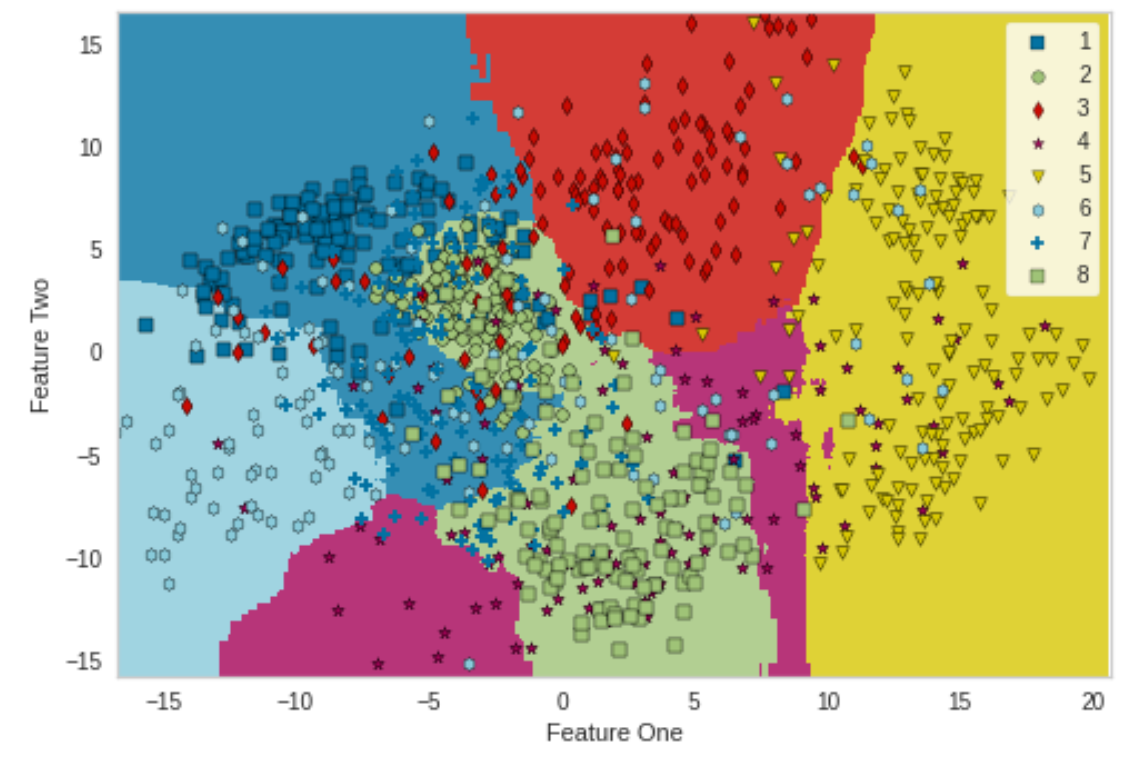
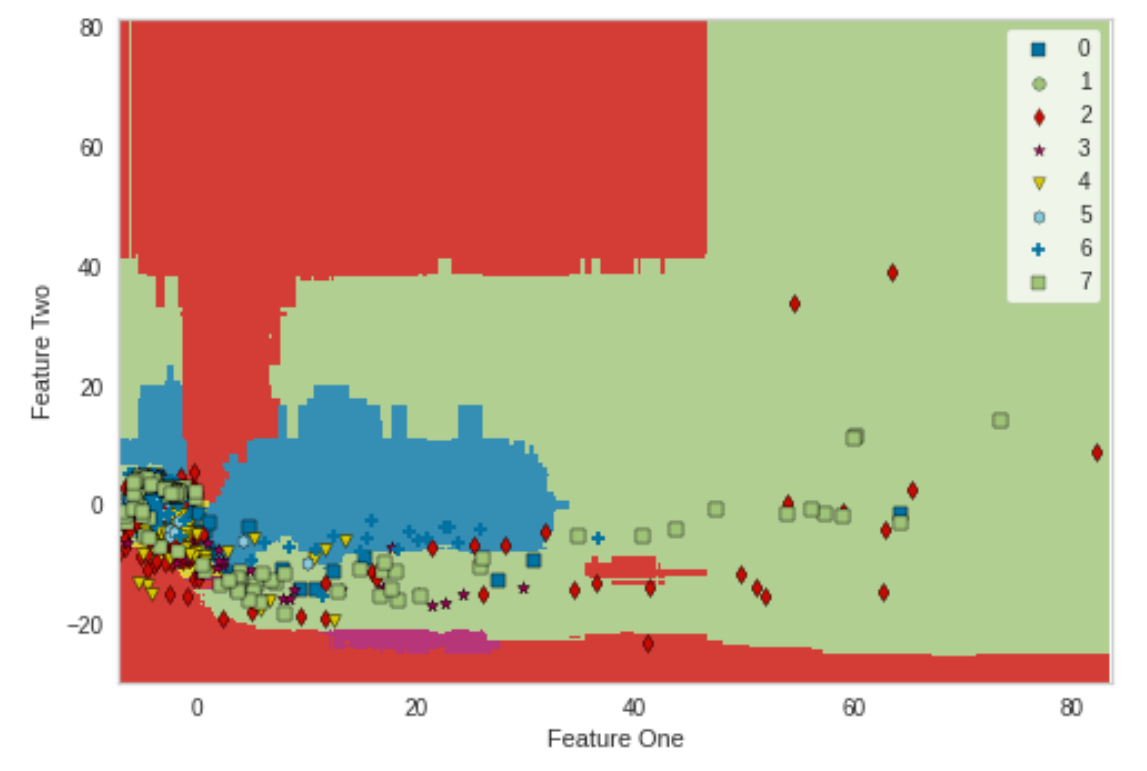
The above ROC signifies the AUC scores were very consistent across folds, which is a sign of high potential generalizability. Now let's see how the decision boundary for the extra tree classifier looks like based on two features:
As seen, except for a few samples, extra tree classifier managed to create a clear decision boundary for different types of gestures. In such a scenario, a linear SVM (with a linear kernel) was also expected to work better, but actually it didn't; whereas tree-based models work much better.
To further compare, I created another notebook with PyCaret, but the models were trained on features PyCaret_with_FE_Numpy.ipynb extracted with pure NumPy. Let's see how extra tree classifier performed across different gestures types w.r.t confusion matrix:
As we can see the classifier made more wrong predictions than that when features were extracted using sktime library, making it more confused among classes. Now let's see how the decision boundary for the extra tree classifier looks like based on two features:
As seen, the decision boundary for the extra tree classifier looks quite different, perhaps due to different way of stacking of samples and quality of the features extracted.
I also developed the solution in DeepLearning4j, just to show that depending upon the requirements, I can work in Java too. The Java version is pushed in the java branch. Using the logistic regression, following results were achieved:
Precision: 0.85
Recall: 0.88125
Accuracy: 0.8461538461538461
This is a Maven project, by the way. I can give a live demo too, if you'd be interested in.
- Data quality assessment
- Using k-fold cross validation + grid/random/Bayesian hyperparameter optimization
- Regularization, e.g., LASSO to penalize certain params if they are likely to create overfitting, drop out, Gaussian noise
- Concept/data drift and generalizability
- Data bias, imbalance, fairness
- Black-box vs. interpretability
- Adversarial robustness
- Privacy-preserving capability
- Multimodality
- Model compression for resource-constrined devices (e.g., edge, mobile devices) -> model surrogation, model pruning, dimensionality reduction
- Reducing inferencing time.
As just training and evaluating a model is of no use unless it can be used as a web application, e.g., own website, cloud, or production ready environment. Therefore, we need to think how a model and its associated workflow/pipeline can be converted as a ML software product.
- T2.1: How would you design a DevOps pipeline using e.g. GitHub Actions for a Python package? Which functionalities would you include to ensure code quality and consistency?
- T2.2: Assuming the pipeline you implemented will be deployed as a product. Now the customer also wants to enable real time classification and consume an API that returns the classification results. How would you fit that into the existing architecture?
- T2.3: The whole system has been a huge success and also other customers want to use it. How would you adapt everything to be able to serve multiple customers--, especially keep in mind scalability and data privacy?
- T2.4: What would you recommend to automatically transfer machine learning models to production by running microservices for inferencing?
The following figure represents the high-level workflow for making a ML model a ML software product:
Following are minimal solutions to these tasks related to making the ML software ready:
- Training a machine learning model on a local system or cloud
- Creating a frontend to make the model accessible via the web using a web framework e.g., Streamlit
- Wrapping the inference logic with a backend framework e.g., FastAPI
- Using docker to containerize the application
- Create clusters and hosting the docker container on the cloud (or on premise) to and deploy the ML pipeline and consuming the web-service.
Task 2.1 - How would you design a DevOps pipeline using e.g. GitHub Actions for a Python package? Which functionalities would you include to ensure code quality and consistency?
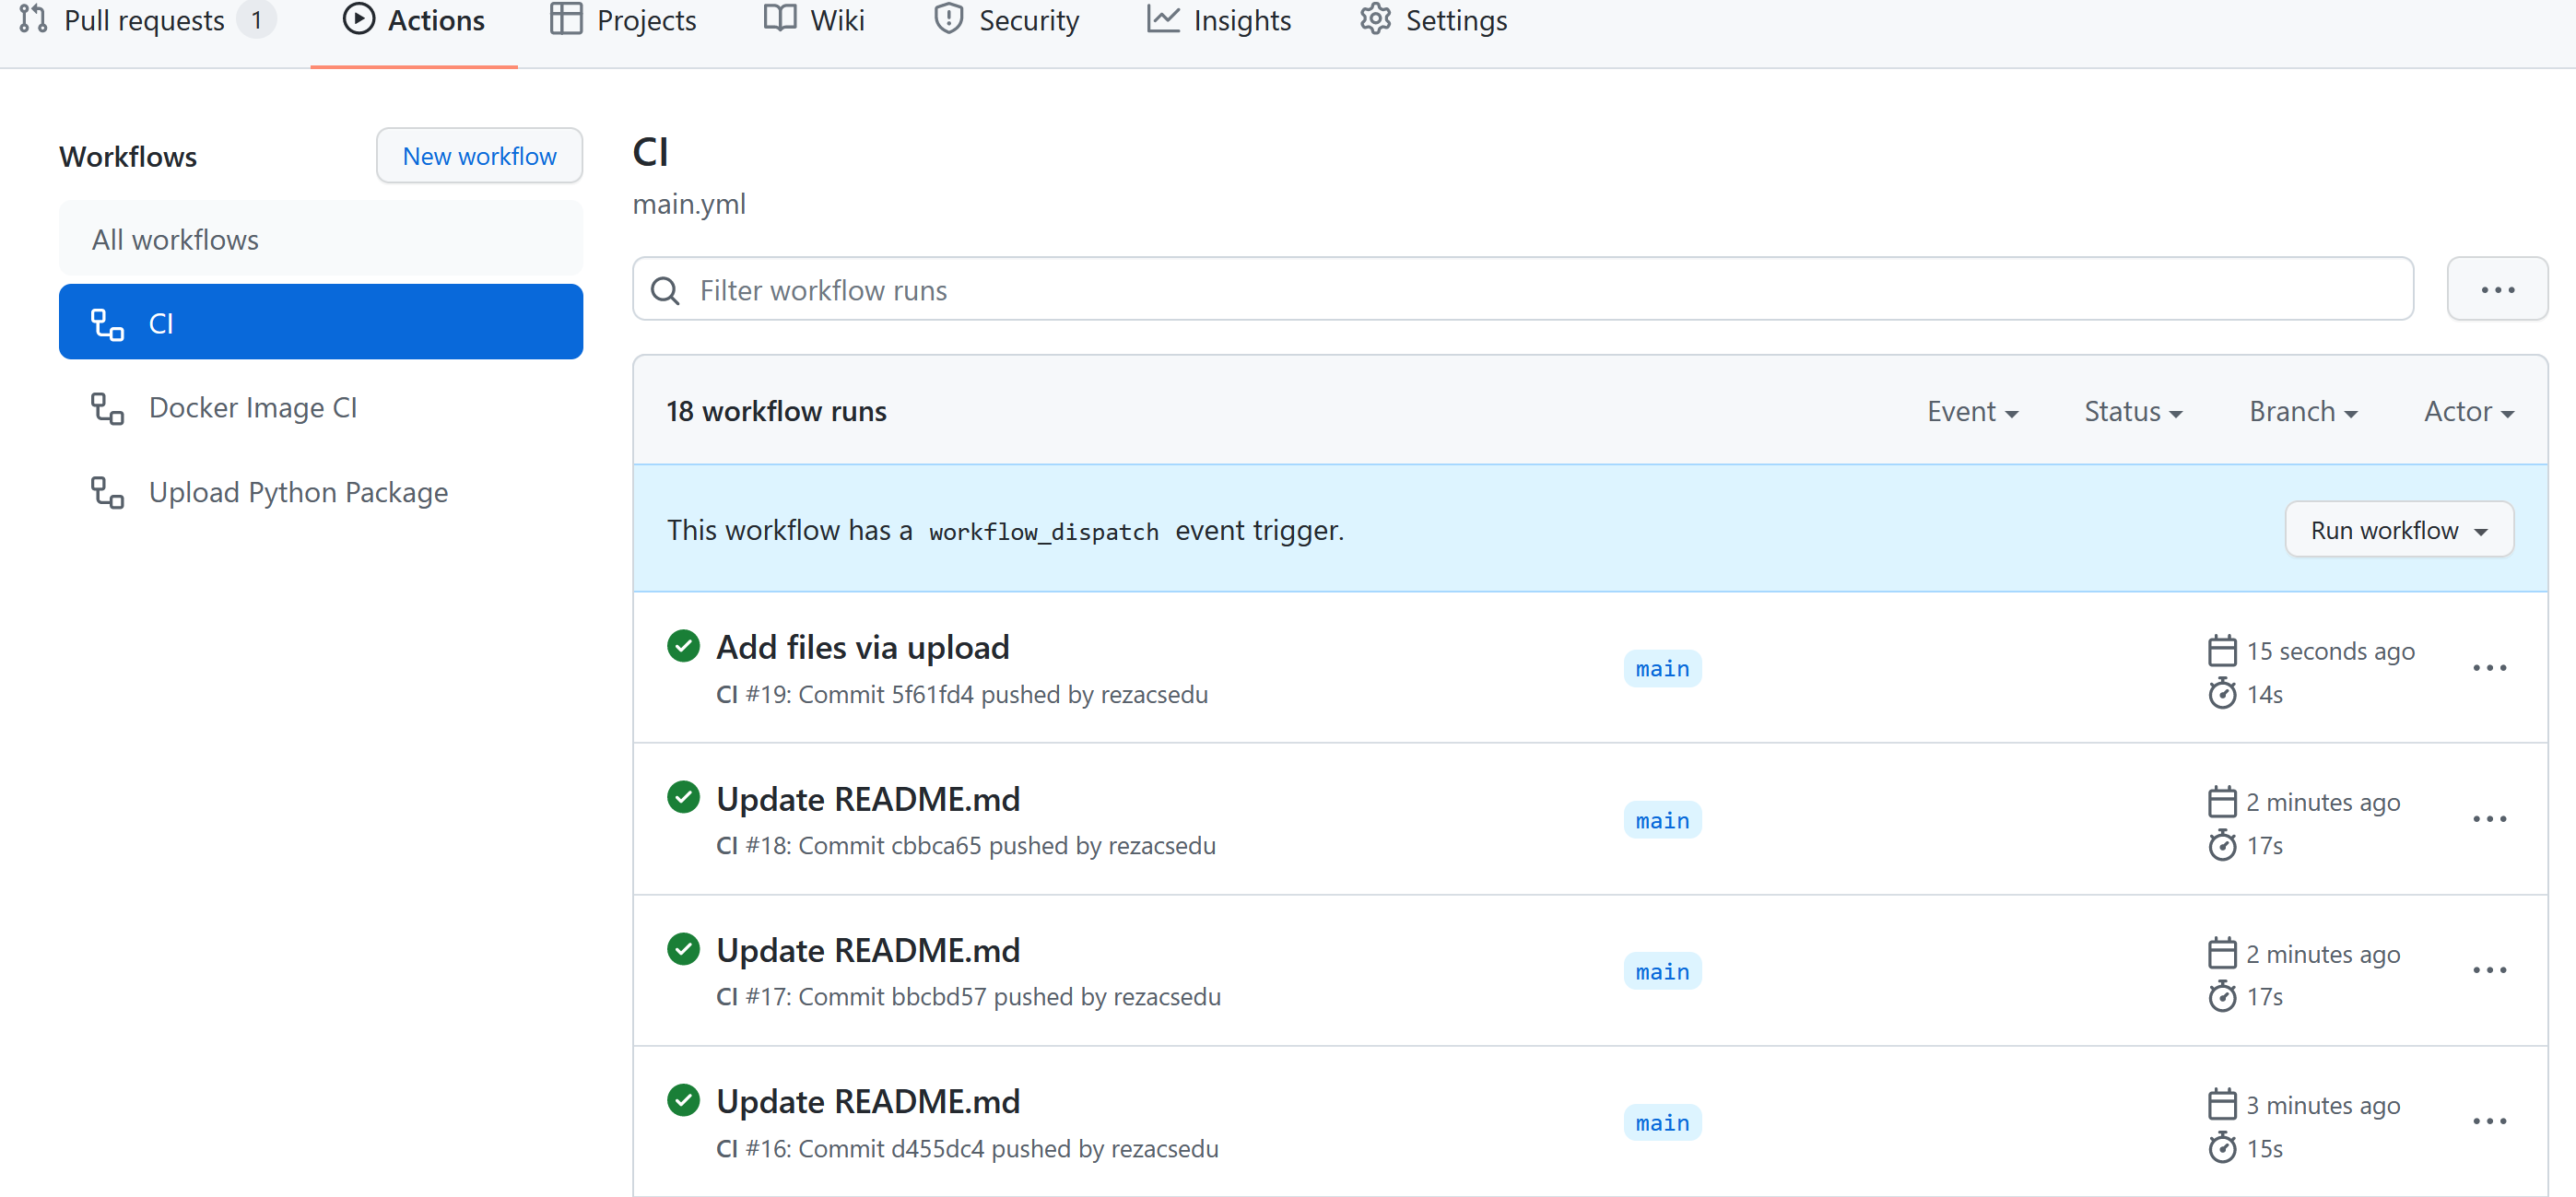
Although, I used GitHub Actions for setting up workflow_dispatch event trigger for CI, to be honest, I don't have much experience of designing a DevOps pipeline using e.g., GitHub Actions or creating Python package for PyPI. But as far as I remember, once I employed the CodeQL Analysis workflow, which runs a series of CodeQL security tests on code after we merge it to the main branch to ensure there are no known vulnerabilities. The workflow visualizer and live logs are also extremely useful to get a full look into how the pipeline is running. The following figure shows what different triggered events for the CI workflows:
Apart from setting up the CI/CD in an automated way, we practice peer review and test-driven development (TDD) that include coding, testing (unit test, for examples). Further, we follow commenting, consistent use of spaces, tabs, clean codes, modular programming, consistency in naming convention, etc. Please don't ask, how much of these I followed for this repo! ;)
Task 2.2 - Assuming the pipeline you implemented will be deployed as a product. Now the customer also wants to enable real time classification and consume an API that returns the classification results. How would you fit that into the existing architecture?
Deploying and serving the model as a web app via REST API with FastAPI (for backend) and Streamlit (for frontend). In such a setting, uvicorn works for serving the API. The uvicorn is a good choice (e.g., compared to Apache or nginx) as it is a lightning-fast ASGI (aka. Asynchronous Server Gateway Interface) server implementation.
Task 2.3 & T2.4 - The whole system has been a huge success and also other customers want to use it. How would you adapt everything to be able to serve multiple customers--, especially keep in mind scalability and data privacy? What would you recommend to automatically transfer machine learning models to production by running microservices for inferencing?
The whole application (FastAPI + Streamlit) can be packaged using Docker (containerized). However, instead of having two separate services running, both front- and backend can be containerized with Docker-compose. Having a docker-compose file configured, we can no longer need to build each Dockerfile of different images at a time or separately. Then REST API call can be performed batch prediction or inferencing. Make sure to employ asynchronous programming while creating prediction routes in FastAPI. More specifically, we can use "async" function when creating the prediction FAstAPI routes. This will enable the FastAPI to create multiple routes concurrently. Alternatively, Flask 2.0 can be used that supports async routes now. In particular, the "httpx" library and use the "asyncio" co-routines. Nevertheless, in my earlier days, I used to use "semaphore" to limit number of concurrent requests using the asyncio library for that.
For security, I don't have much working experience, but previously, I used the security utilities of FastAPI. In particular, using OAuth2 enables authentication to authorized users only by generating passwords for respective bearers. On the other hand, when we have millions of concurrent users, Kubernetes or docker-swarm can be used for running and coordinating containerized applications across a cluster of machines. I roughly know about docker-swarm but did some deployment with kubernetes. Once a Docker image built, it can be uploaded to Google Container Registry (GCR). Once the container is uploaded on GCR, a cluster consists of a pool of Compute Engine VM instances need to be created for running the app onto Google Kubernetes Engine (GKE).
However, when it comes to having features like model tracking, logging, and registry, MLflow can be used. MLflow also integrates well within the CI/CD pipeline and, during MLOps, where Data Scientist and ML Engineers can work collaboratively with deployment engineers to develop and deploy new versions of ML models and monitor their performance. Nevertheless, Kubeflow is another option too. It is a platform for data scientists who want to build and experiment with ML pipelines. Kubeflow is also for ML engineers and operational teams who want to deploy ML systems to various environments for development, testing, and production-level serving.
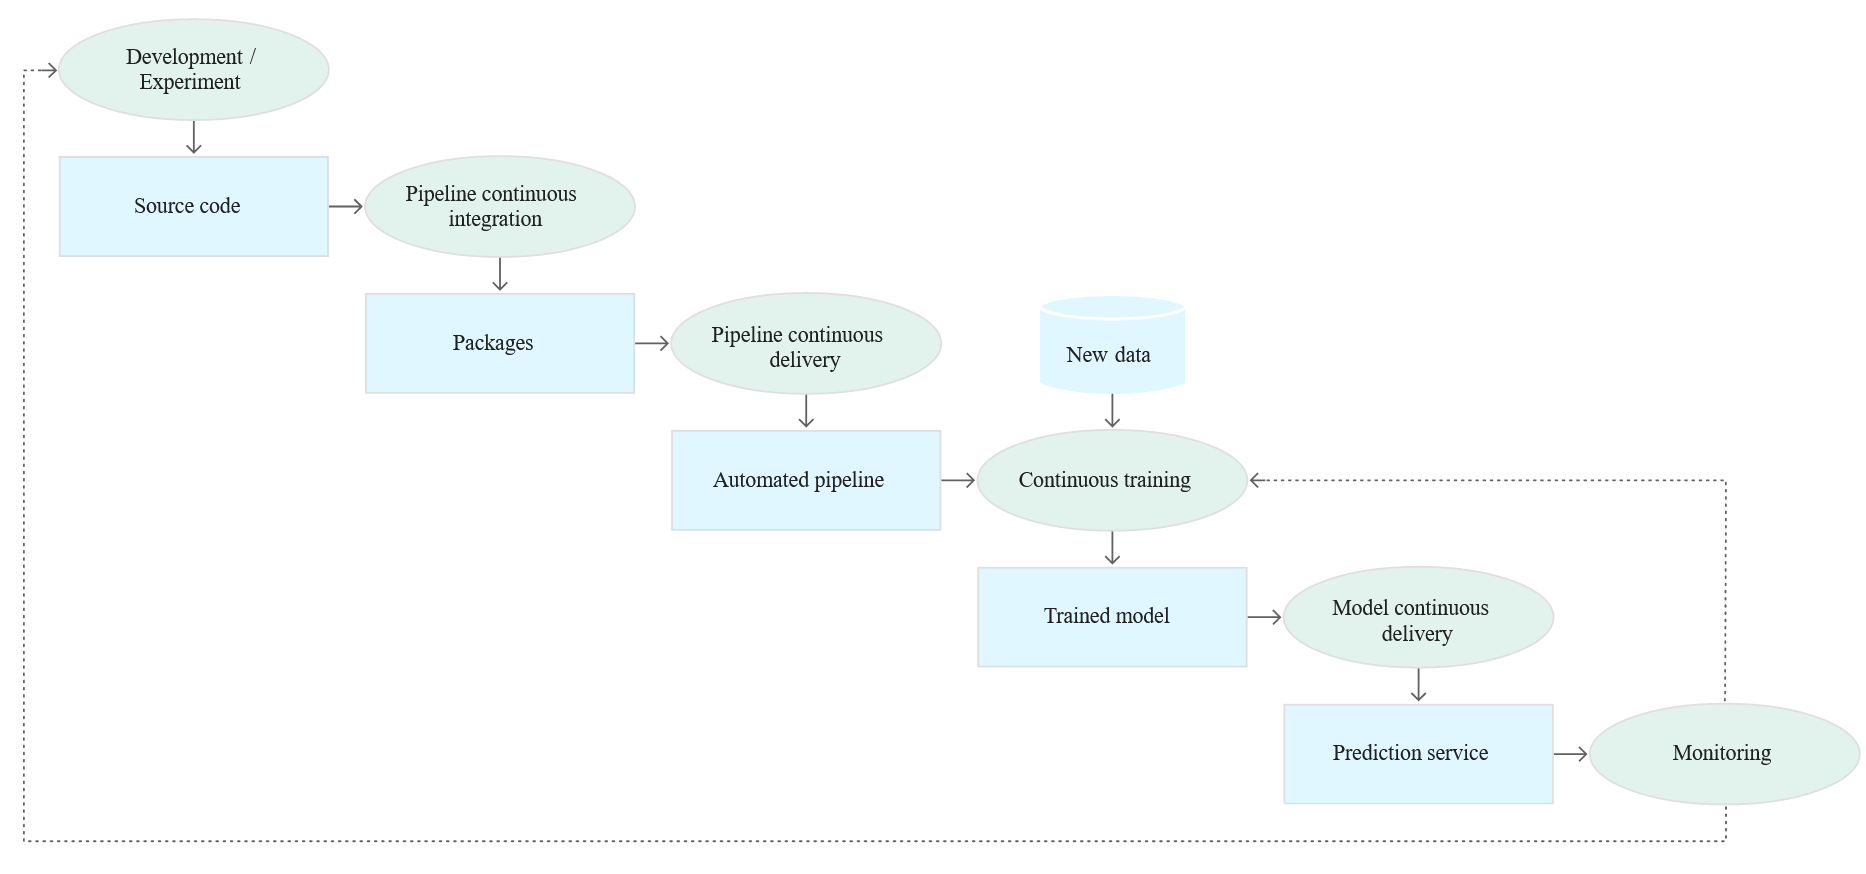
Finally, taking into consideration of all the CI/CD, deployment, and monitoring stuff, the following diagram shows overall stages of an ML CI/CD automation pipeline:
