If you use this code or application, please cite the original paper published by Bioinformatics: 10.1093/bioinformatics/btx760
Current Version: 1.1.20 (Godzilla)
 |
 |
 |
 |
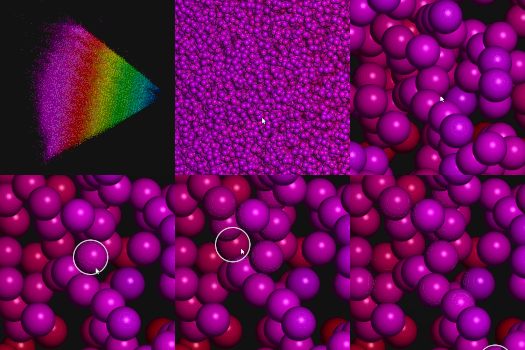
Browsing the SureChEMBL database (containing > 12 million datapoints): Faerun.
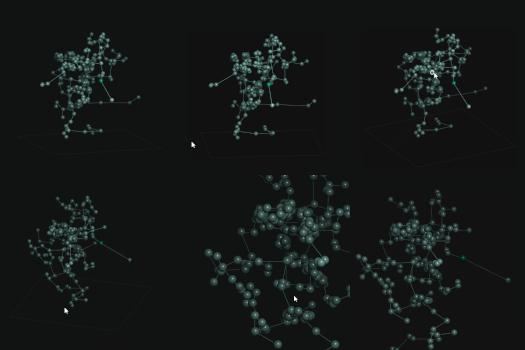
A basic fiddle See the examples folder for more details.
You can either download or clone this repository and use the JavaScript file in the dist folder, or you can use yarn to install the package lore-engine:
yarn add lore-engineIf you decide not to use the ready-to-go scripts in dist, you can (edit and) build the project by running:
npm install
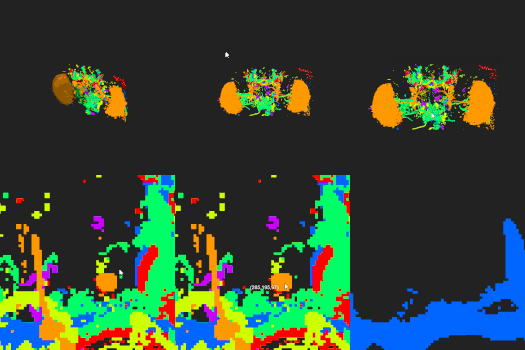
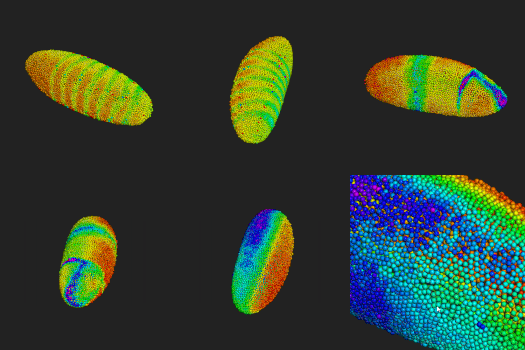
gulpA simple example can be found in the example folder. The example data file was downloaded from the website of the Berkeley Drosophila Transcription Network Project. It is a very small data set (N=6000) chosen because of the small file size (larger files can not be hosted on github).
| Option | Identifier | Data Type | Default Value |
|---|---|---|---|
| Antialiasing | antialiasing | boolean | true |
| Verbose Mode | verbose | boolean | false |
| The HTML element where FPS info is displayed | fpsElement | HTMLElement | document.getElementById('fps') |
| The canvas background color | clearColor | Lore.Color | Lore.Color.fromHex('#000000') |
| The distance of the camera to the center | radius | number | 500 |
| Clear Depth | clearDepth | number | 1.0 |
| Center (LookAt) | center | Lore.Vector3f | new Lore.Vector3f() |
| Enable depth test | enableDepthTest | boolean | true |
| Enable alpha blending | alphaBlending | boolean | false |
The options for the coordinate helper are self-explanatory:
{
    position: new Lore.Vector3f(),
    axis: {
        x: {
            length: 50.0,
            color: Lore.Color.fromHex('#222222')
        },
        y: {
            length: 50.0,
            color: Lore.Color.fromHex('#222222')
        },
        z: {
            length: 50.0,
            color: Lore.Color.fromHex('#222222')
        }
    },
    ticks: {
        enabled: true,
        x: {
            count: 10,
            length: 5.0,
            offset: new Lore.Vector3f(),
            color: Lore.Color.fromHex('#1f1f1f')
        },
        y: {
            count: 10,
            length: 5.0,
            offset: new Lore.Vector3f(),
            color: Lore.Color.fromHex('#1f1f1f')
        },
        z: {
            count: 10,
            length: 5.0,
            offset: new Lore.Vector3f(),
            color: Lore.Color.fromHex('#1f1f1f')
        }
    },
    box: {
        enabled: true,
        x: {
            color: Lore.Color.fromHex('#222222')
        },
        y: {
            color: Lore.Color.fromHex('#222222')
        },
        z: {
            color: Lore.Color.fromHex('#222222')
        }
    },
}| Option | Identifier | Data Type | Default Value |
|---|---|---|---|
| Visualize the octree (for debug purposes) | visualize | boolean or string | false, 'centers', 'cubes' |
| Enable multiselect | multiSelect | boolean | true |
| Option | Identifier | Data Type | Default Value |
|---|---|---|---|
| Create an octree when setting positions | octree | boolean | true |
| The maximum number of vertices in a octree node | octreeThreshold | number | 500 |
| The maximum depth of the octree | octreeMaxDepth | number | 8 |
| Point size scaling | pointScale | number | 1.0 |
| The maximum point size | maxPointSize | number | 100.0 |
The documentation can be found in the docs folder. A markdown version is available here
Big thanks to Browserstack for providing us with their excellent App and Browser Testing service. This allows us to test our library quickly on a wide range of browsers and operating systems.

