![]()
Grafana datasource plugin that provides access to a GraphQL API for numerical timeseries data, general/tabular data, annotations, and dashboard variables.
- The GraphQL query must be structured so that the data of interest is returned
under the configurable data path (default
data) in the response. If the object at that path is an array it will be iterated over, with each object added as a row in the data frame, otherwise the result object will be the only row.- Can be separated by commas to use multiple data paths
- Timeseries data requires a field named
Timecontaining the timestamp in a format that can be parsed bymoment()(e.g. ISO8601). - Nested types will be flattened into dot-delimited fields.
- Grafana variables should be substituted directly in the query (instead of
using GraphQL variables). The dashboard time ranges are available in the
global variables
$__fromand$__toas millisecond epoch (or in whatever format is needed by the API in Grafana 7.1.2 or later). - Group by can be used to group elements into multiple data points.
- Alias by is used to alter the name of the field displayed in the legend.
$field_<field.name>is substituted with the values of the field and$fieldNameis substituted with the name of the field.
Below are some example queries demonstrating how to use the plugin. See the project wiki for further examples and tutorials.
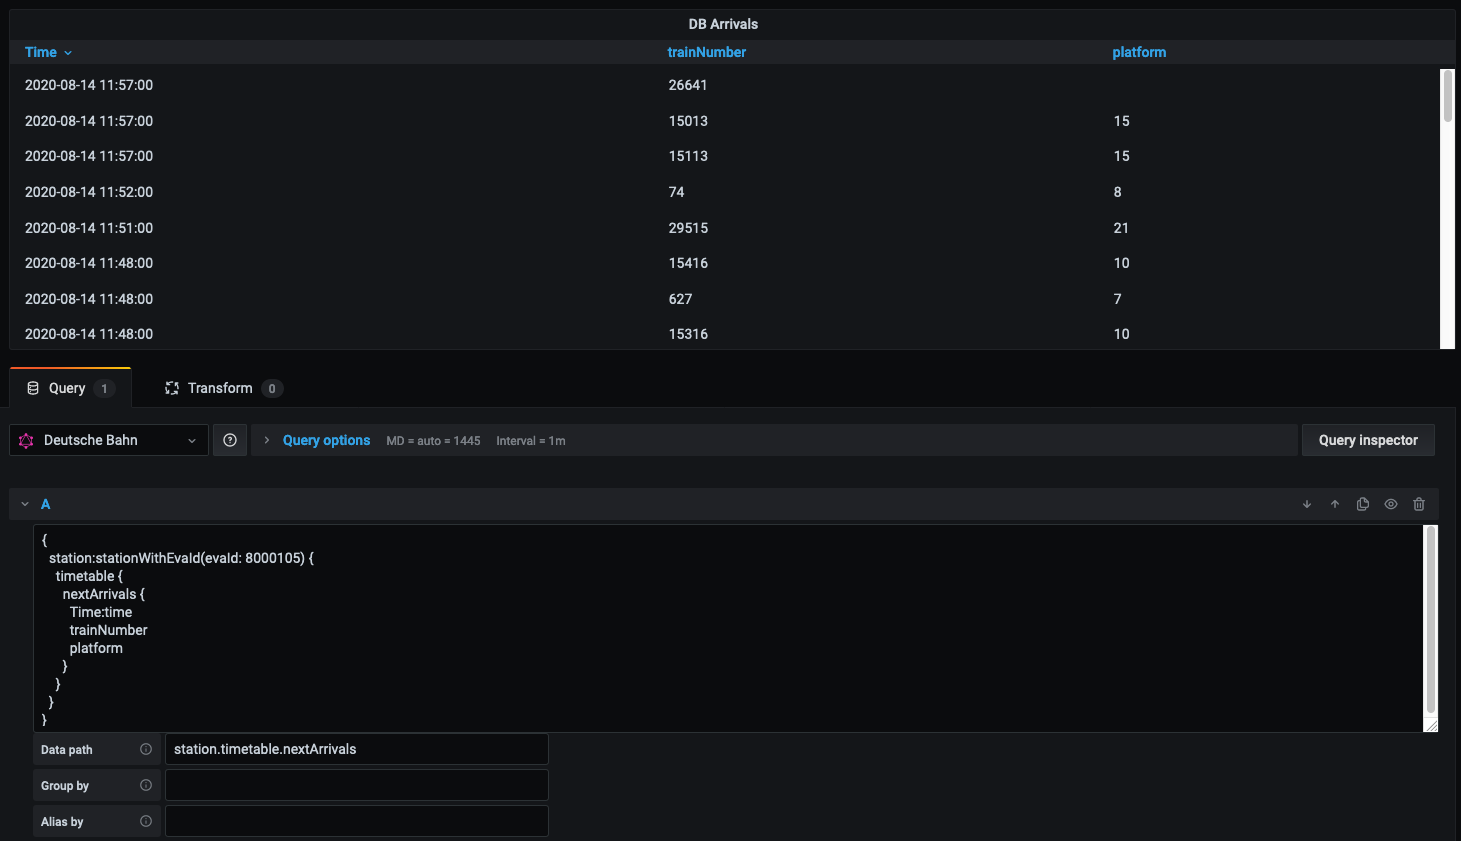
query {
  submissions(user: "$user", from: "$__from", to: "$__to") {
    Time: submitTime
    idle
    running
    completed
  }
}- Data path:
submissions
Note the use of the global $__from and $__to variables to insert the
dashboard time range into the query, alongside a dashboard variable $user.
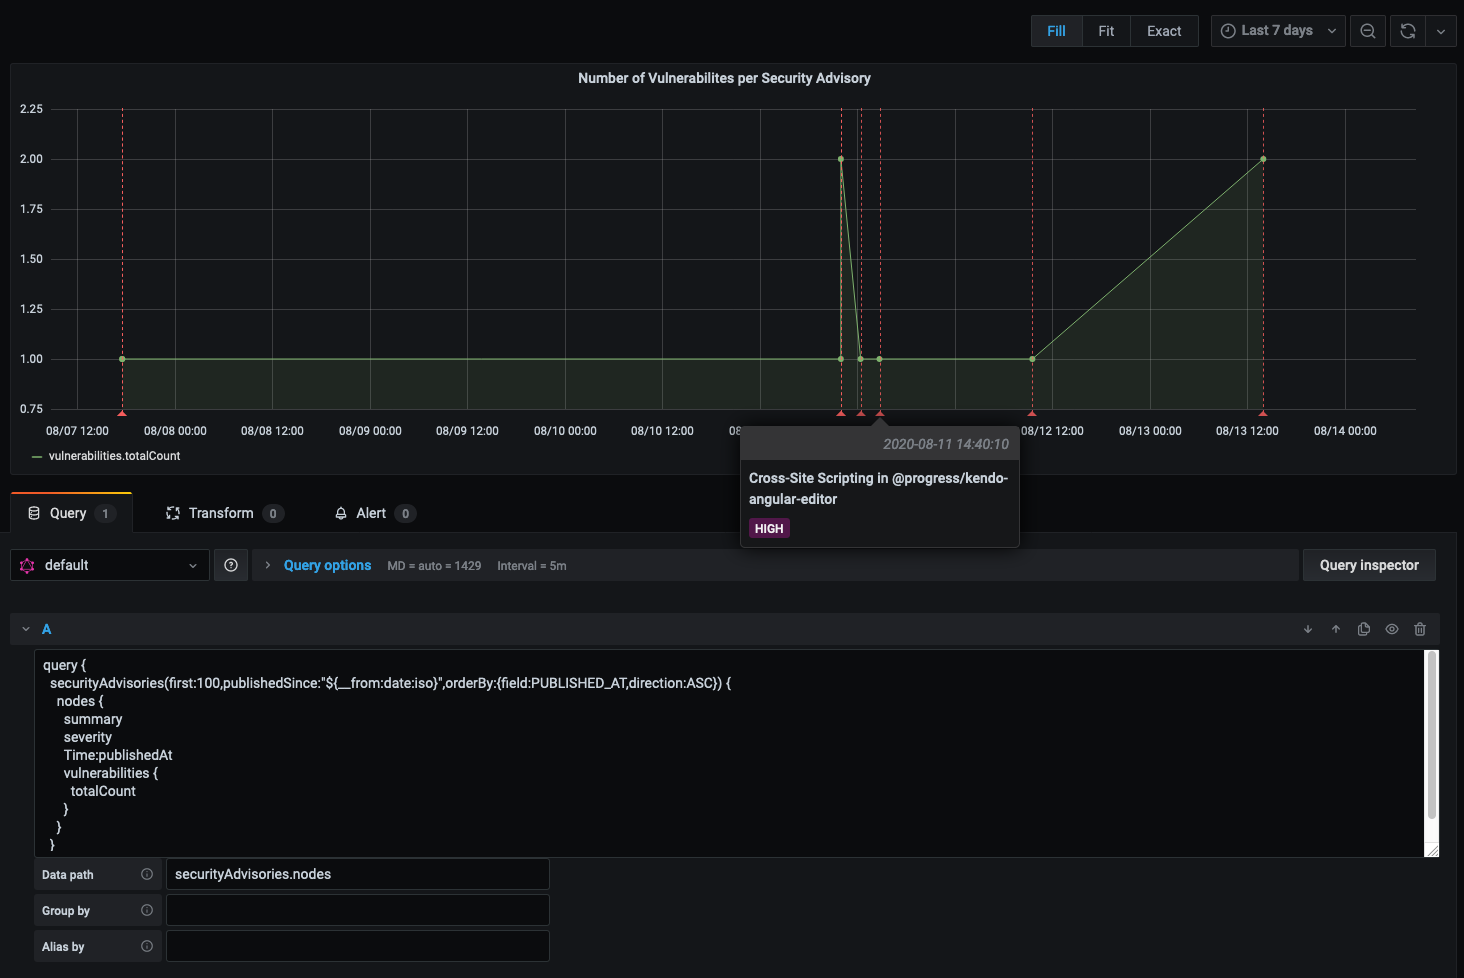
query {
  data: queryAll(from: "$__from", to: "$__to", sourceId: "default") {
    batteryVoltage {
      Time: dateMillis
      packet {
        batteryVoltage
        identifier {
          representation
        }
        identityInfo {
          displayName
        }
      }
    }
  }
}- Data path:
data.batteryVoltage - Group by:
packet.identifier.representation - Alias by:
$field_packet.identityInfo.displayName
In the above example, "Group by" and "Alias by" are defined. "Group by" allows
you to split up an array of data into multiple data points. "Alias by" is used
as the name of the data point. You can make alias use text from the query or
even the field name by using $field_<your.field.name> for the value of the
field, or $fieldName for the name of the field. For instance, if $fieldName
was used, it would be replaced by "batteryVoltage" because that's the name of
the field. If $field_identityInfo.displayName was used, it would be replaced
with the value of displayName. Using $fieldName can be useful if you're
querying multiple numeric fields that you want displayed in your graph.
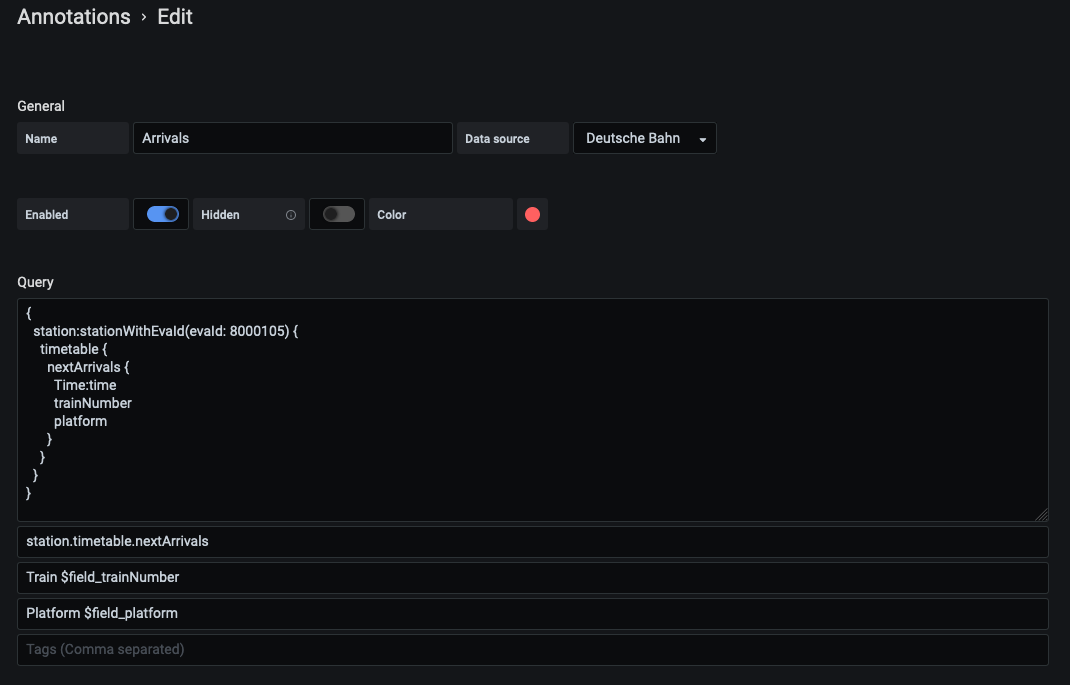
query {
  server1: queryEvents(from: "$__from", to: "$__to", server: "server1") {
    birthdayEvent {
      Time: dateMillis
      person {
        fullName
      }
    }
  }
  server2: queryEvents(from: "$__from", to: "$__to", server: "server2") {
    birthdayEvent {
      Time: dateMillis
      person {
        fullName
      }
    }
  }
}- Data path:
server1.birthdayEvent, server2.birthdayEvent - Title:
Birthday yay! - Text:
$field_person.fullName - Tags:
tag1, tag2
The above annotation example is similar to regular queries. You must have a
Time field and are able to define a data path. Similar to the last example,
you can also substitute values into the title, text, and tags by using
$field_<field name>. By using $field_person.fullName as the text, the text
in this annotation will be the person's full name. Tags are separated by commas.
The above example has two tags: "tag1" and "tag2". If a TimeEnd field is
present, the annotation will be shown over a period of time. You can also
separate the data path with commas to provide multiple data paths as shown with
both server1 and server2.