datagrafy (german: datengraphie)
- datagrafy is a form of data / information art (https://en.wikipedia.org/wiki/information_art) and digital art
- It uses arbitrary data (Pictures, Video, Audio, Text, Numbers) as source material
- But i also uses raw data as "drawing material"
- That makes datagrafy unique
- Artefacts (Datagrafies) are created by self-developed software (currently datengraphie 1.5.0.1), while source materials may stem from third parties
- Datagrafies may be graphics, video or audio
- Datagrafies consist of Daxels (Pi-xel -> Data-xel -> Da-xel), which have ususally x and y > 1. Pixels are with x==y==1 special cases of daxels
- Datagrafies as a whole are usaully quite large (1m x 1m up to 5m x 5m). Because of that they have to be scaled down for being shown digitally. This implies, that one of the core characteristics of datagrafy is not visible when shown digitally: The detail level when getting close and the existence of superordinate structure while being far
- Especially for Video-Datagrafies (Mode: datengraphie.vid*) current off-the-shelf PCs may be a challenge - or: vice versa. Videos with resolutions > 4000 are not easy to be played
- datagrafy defines Iconography of data - the visual language of data
- Drawing with letters (Mode: datengraphie.txtrgb)
- A picture and a text are used as input
- The picture is transformed and gets drawn on / by the text
- Sample below shows "Gretchenfrage"
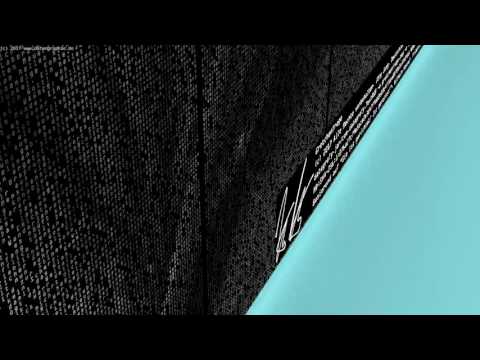
- Drawing with audio (Mode: datengraphie.pcmrgb)
- An audio-file and a picture are take as input
- The picture is transformed and gets drawn on / by the audio data
- Sample below shows "0,000016" in the series "kosmos"
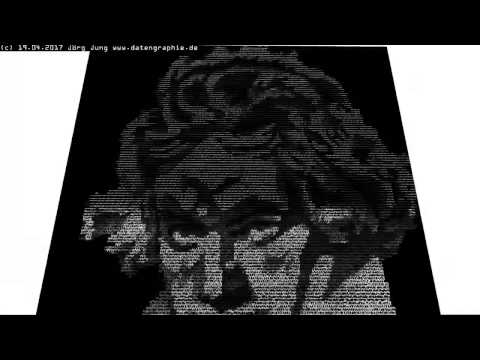
- Drawing with audio (Mode: datengraphie.vidpcmrgb)
- An audio-file and a video are taken as input
- The Video is transformed frame-by-frame and gets drawn on / by the audio data; synced with the audio data, so that the audio data is visible as it gets played
- Sample below shows "Ludwig auf Daten" in the series "auf daten"
Many Datagrafies are aggregated in series, as they deal with similar contents or are similarily structured in a technical way - in a broad sense
- biblioism for example is about the transformation of books and texts. The Datagrafy Gottes Buch und des Digitalen Beitrag (which roughly translates to: God's book and Digital's contribution) is based on Luther Bible (Revision from 1912) and a numerical series consisting of hits of every book in the bible in a not so well known search engine (Mode: datengraphie.txtrgb)
- graphlaut deals with the transformation of data into "music" (graphlaut is by the way the reason for having "drawing material" in quotes - sounds get "drawn"). The Datagraphy Diffus shows kind of a special effect. Here music is created from a picture (Mode: datengraphie.rgbpcm). In the next step that music is taken as input to the creation of a picture from music (Mode: datengraphie.pcmrgb). With well chosen parameters the picture created in the second step shows a form of the initial picture - the visual got encoded in music. Some people may recognize Mr. Franz Kafka.
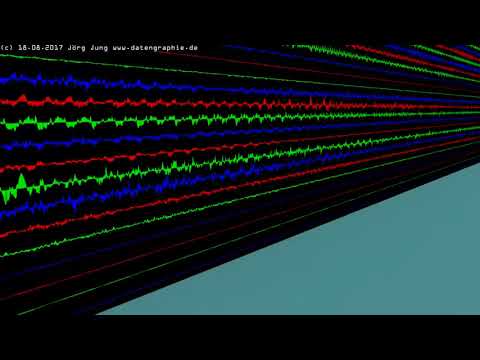
- lautgraph as a last example is about creating pictures from music / audio. The Datagraphy Entzug der Sinne (which roghly translates to: Deprivation of senses) simply shows the transformation of one piece of music - nothing else - green on black, music.
- http://datengraphie.de
- Discuss on github wiki: (https://github.com/retevastum/datagrafy/wiki)
- Discuss on slack: (https://retevastum.slack.com)
- There is a group on data art on facebook
- A blog on data art on tumblr