A functional reactive model library. Provides:
- Models similar to Backbone Models in that you can call
set(propertyName, value)to set a value, andget(propertyName)to get a value
- A
whenfunction, which allows declaration of data dependency graphs in a functional reactive style.
Usable via Bower: bower install model
Check out the
- Documentation
- Unit Tests
- Examples
This library was created in order to cleanly define reactive model-driven data visualizations. When using Backbone and Underscore to define model-driven visualizations, there is a pattern that appears again and again for executing code that depends on multiple model properties. For example, consider a Backbone model that has a size property that contains the width and height of the visualization, and a data property that contains the array of data to be visualized. This is the code you want to write:
model.on('change:width change:height change:data', function (){
  var width = model.get('width'),
      height = model.get('height'),
      data = model.get('data');
  // Build the visualization using width, height and data.
});
However, with the above code, if only one or two of the properties are set, the function will be invoked before all properties are defined. Therefore a null check must be added for all properties as follows:
model.on('change:width change:height change:data', function (){
  var width = model.get('width'),
      height = model.get('height'),
      data = model.get('data');
  if(width && height && data) {
    // Build the visualization using width, height and data.
  }
});
The above code now does not break, but has another issue. When width and height are both updated, the function is invoked twice. Ideally, when width and height are updated in sequence (e.g. model.set('width', 50); model.set('height', 100);), the function should only be invoked once with the new values for both width and height. Also, multiple sequential updates to width or height (e.g. model.set('width', 0); model.set('width', 50);) should only result in a single recomputation of the visualization, using the last value (in this case 50). One way to accomplish this is to debounce the function as follows:
model.on('change:width change:height change:data', _.debounce(function (){
  var width = model.get('width'),
      height = model.get('height'),
      data = model.get('data');
  if(width && height && data) {
    // Build the visualization using width, height and data.
  }
}));
The above code behaves as desired - the visualization is only built when all properties are present, and only once when multiple properties change together. As this pattern is so common in developing model driven data visualizations, it would be useful to abstract it away into a reusable function. The model.when function does exactly that. Using model.when, the above code becomes:
model.when(['width', 'height', 'data'], function (width, height, data) {
  // Build the visualization using width, height and data.
});
As this was the only usage pattern I encountered with models when using Backbone for developing visualizations, I decided to introduce a new library that only contains the essential features needed from Backbone Models (in order to remove the Backbone dependency), and the when function, which appears in the world of Functional Reactive Programming and makes working with models for visualizations much nicer. This is why model.js was created.
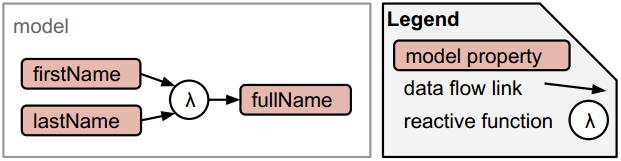
Combining when and set enables creating reactive data dependency graphs. This is similar to computed properties in Ember. As a simple example, consider a fullName property that is computed from firstName and lastName.
model.when(['firstName', 'lastName'], function (firstName, lastName) {
  model.fullName = firstName + ' ' + lastName;
});
The following example demonstrates construction of a data dependency graph in which the flow propagates two hops from x to y to z.
model.when('x', function (x) {
  model.y = x + 1;
});
model.when('y', function (y) {
  model.z = y * 2;
});
This pattern can be used to build up reactive data dependency graphs of arbitrary complexity.
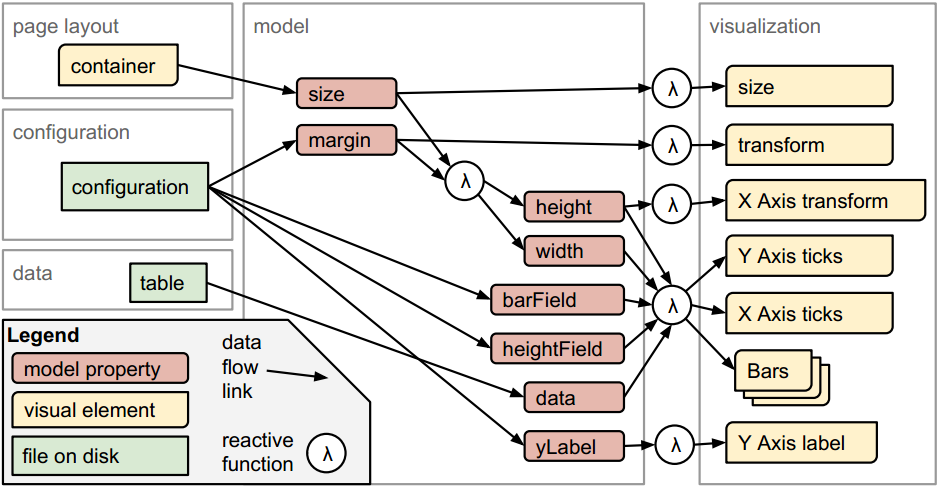
As an example of how model.js data dependency graphs can be used for creating a reactive visualization, here is a diagram showing the data flow pipeline for the bar chart example:
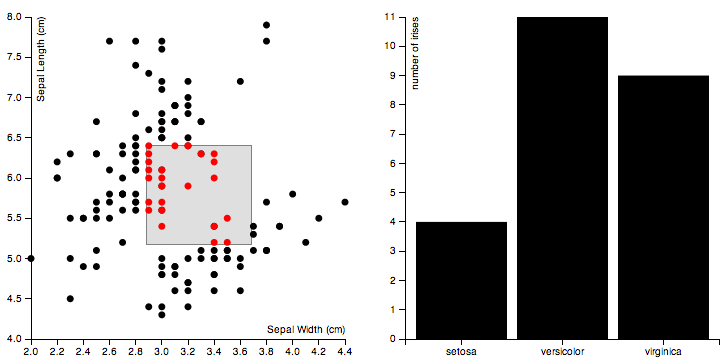
Multiple reactive visualizations can be combined together to form visualization dashboards with multiple linked views. For example, take a look at the linked views example, which looks like this:
Inspired by
- Models in Backbone.js
- The
whenoperator in Functional Reactive Programming - Computed properties in Ember.js
- Dependency injection in Angular.js
- Dependency declaration syntax in Require.js
See also:
- Towards Reusable Charts A pattern for creating reusable charts (model.js presents an alternative to this)
- GitHub: vogievetsky/DVL A functional reactive library for use with D3.js.
- Stackoverflow: how to implement observer pattern in javascript? - Contains bare minimum model implementation that was the seed of this project.
- Backbone.js mailing list: Improving the Backbone Model API with wire() First pass at functional reactive models, built on Backbone models.
- wire.js The original implementation of the idea for this library, as an extension to Backbone Models.
- Backbone Pull Request
- Model.js featured in Dashing D3.js
Pull requests welcome! Potential contributions include:
- Add a DOM-based example
- Add more generalized D3 examples! For example:
- Add a D3 example with UI elements such as a drop down menu for selecting fields to use in the visualization.
By Curran Kelleher July 2014