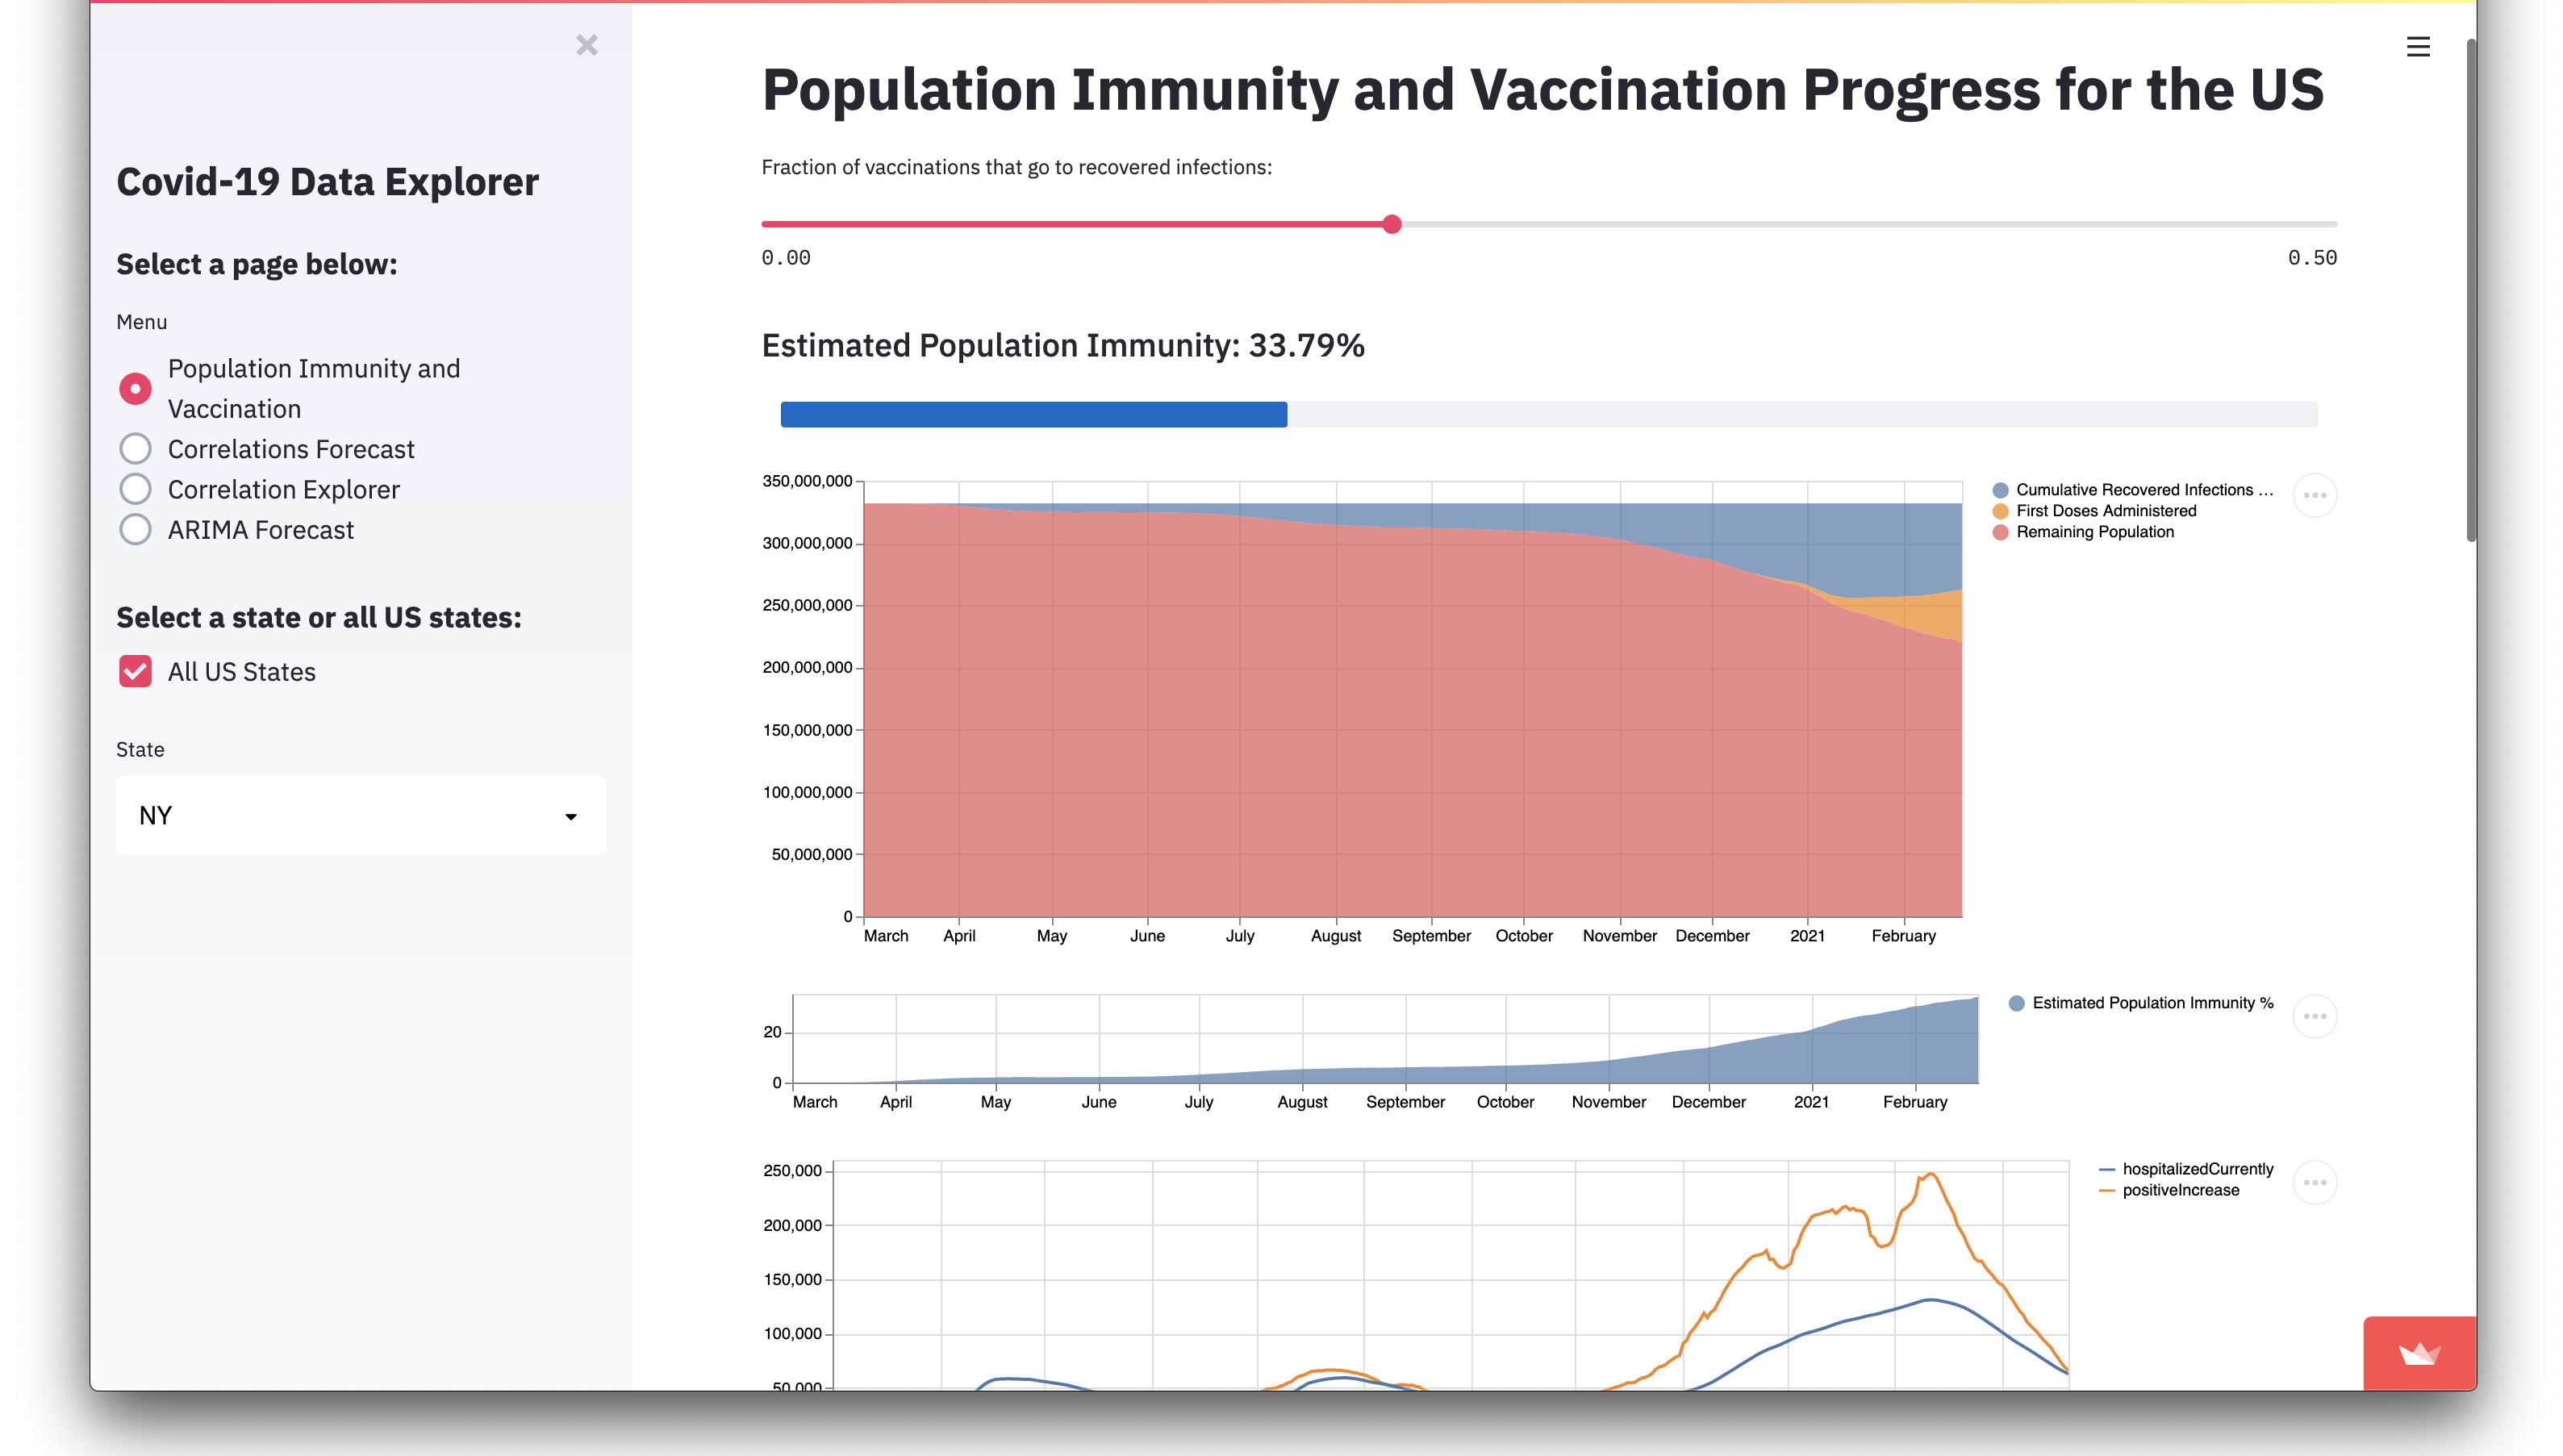
Interactive Covid-19 Forecast and Correlation Explorer
How is this forecast made?
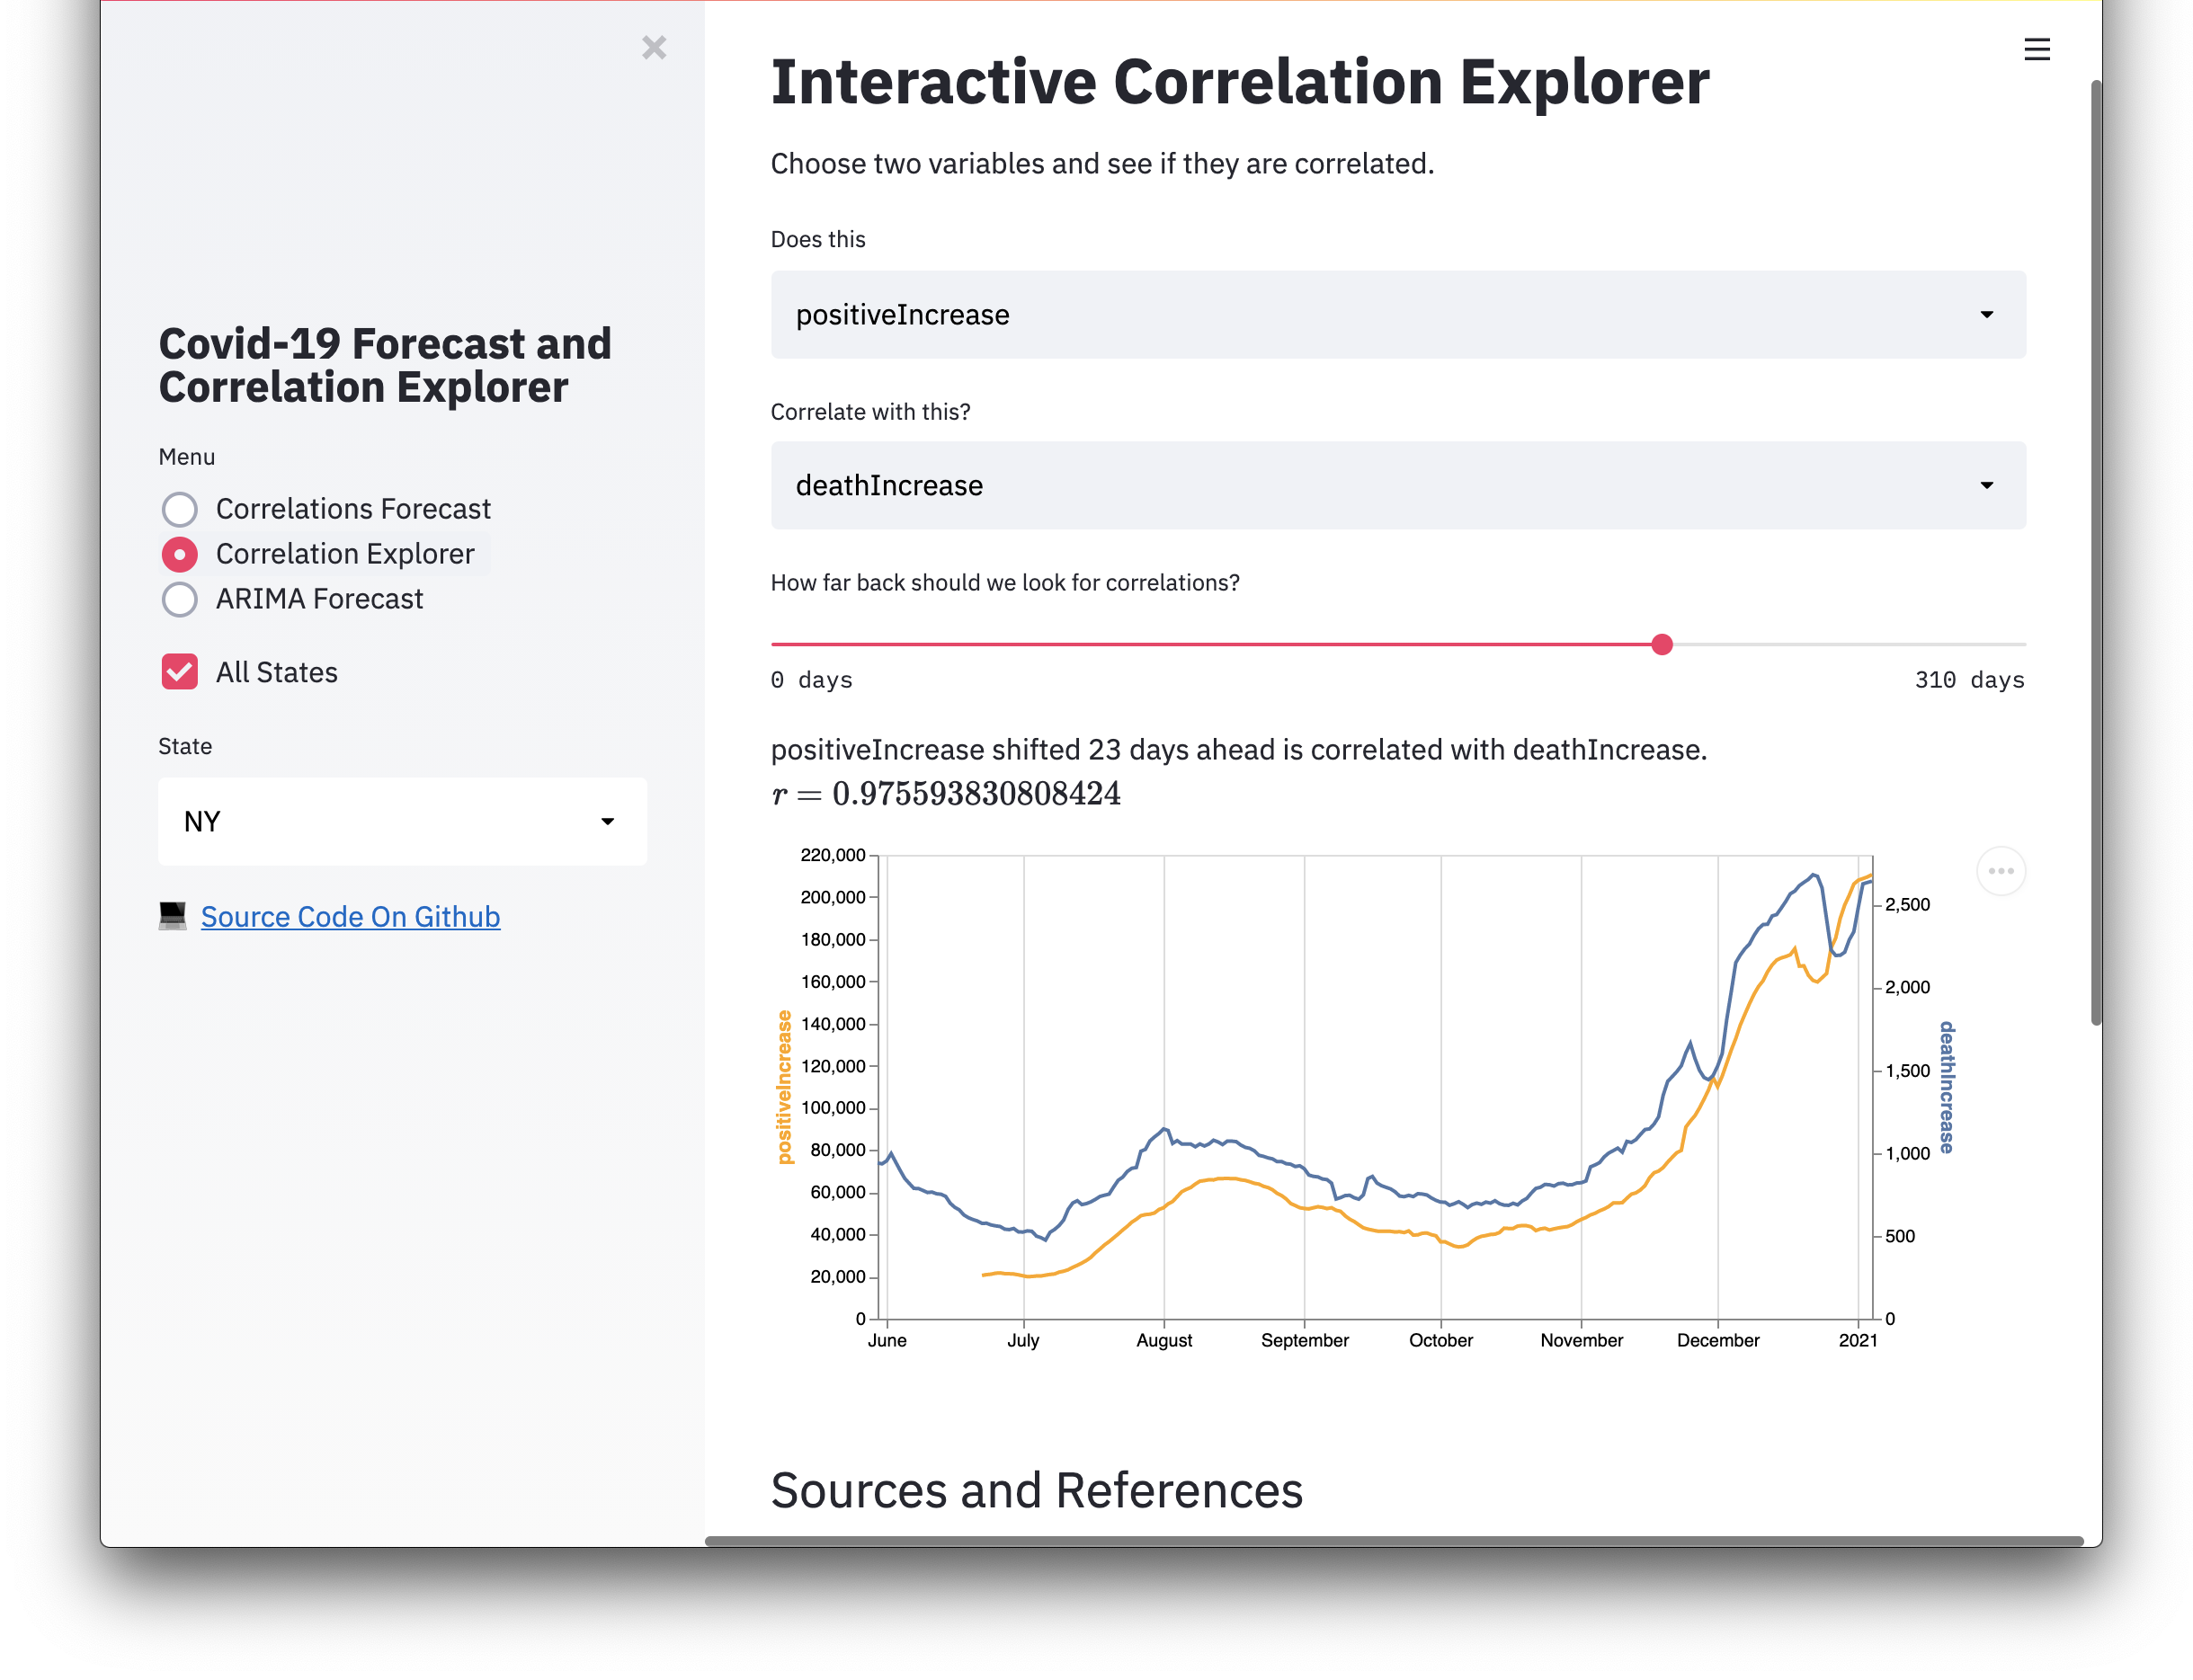
This forecast is a weighted average of correlated variables. shift is the number of days a is shifted forward, and r is the Pearson correlation coefficient between shifted a and b.
The model searches every combination of a, b, and shift for the highest r values. Only correlations >0.5 are used. r is used to weight each component of the forecast, and each component is scaled and aligned to the forecasted variable b. The forecast length is the average shift weighted by the average r.
Ordinary Least Squares regression is also used to scale each series from the a column as well as the final forecast.
You can choose two variables and see if they are correlated.
Infection fatality rate is calculated using the formula described by https://covid19-projections.com/estimating-true-infections-revisited.
Data is pulled daily from https://covidtracking.com
Mobility data is from google.com/covid19/mobility
To Do
-
Score forecasts with MSE or other metric
-
Feed correlated variables into ML regression model for forecasting -
Add Google mobility data -
Add data from https://rt.live
-
PCA, cluster, and TSNE plot different states - In progress
-
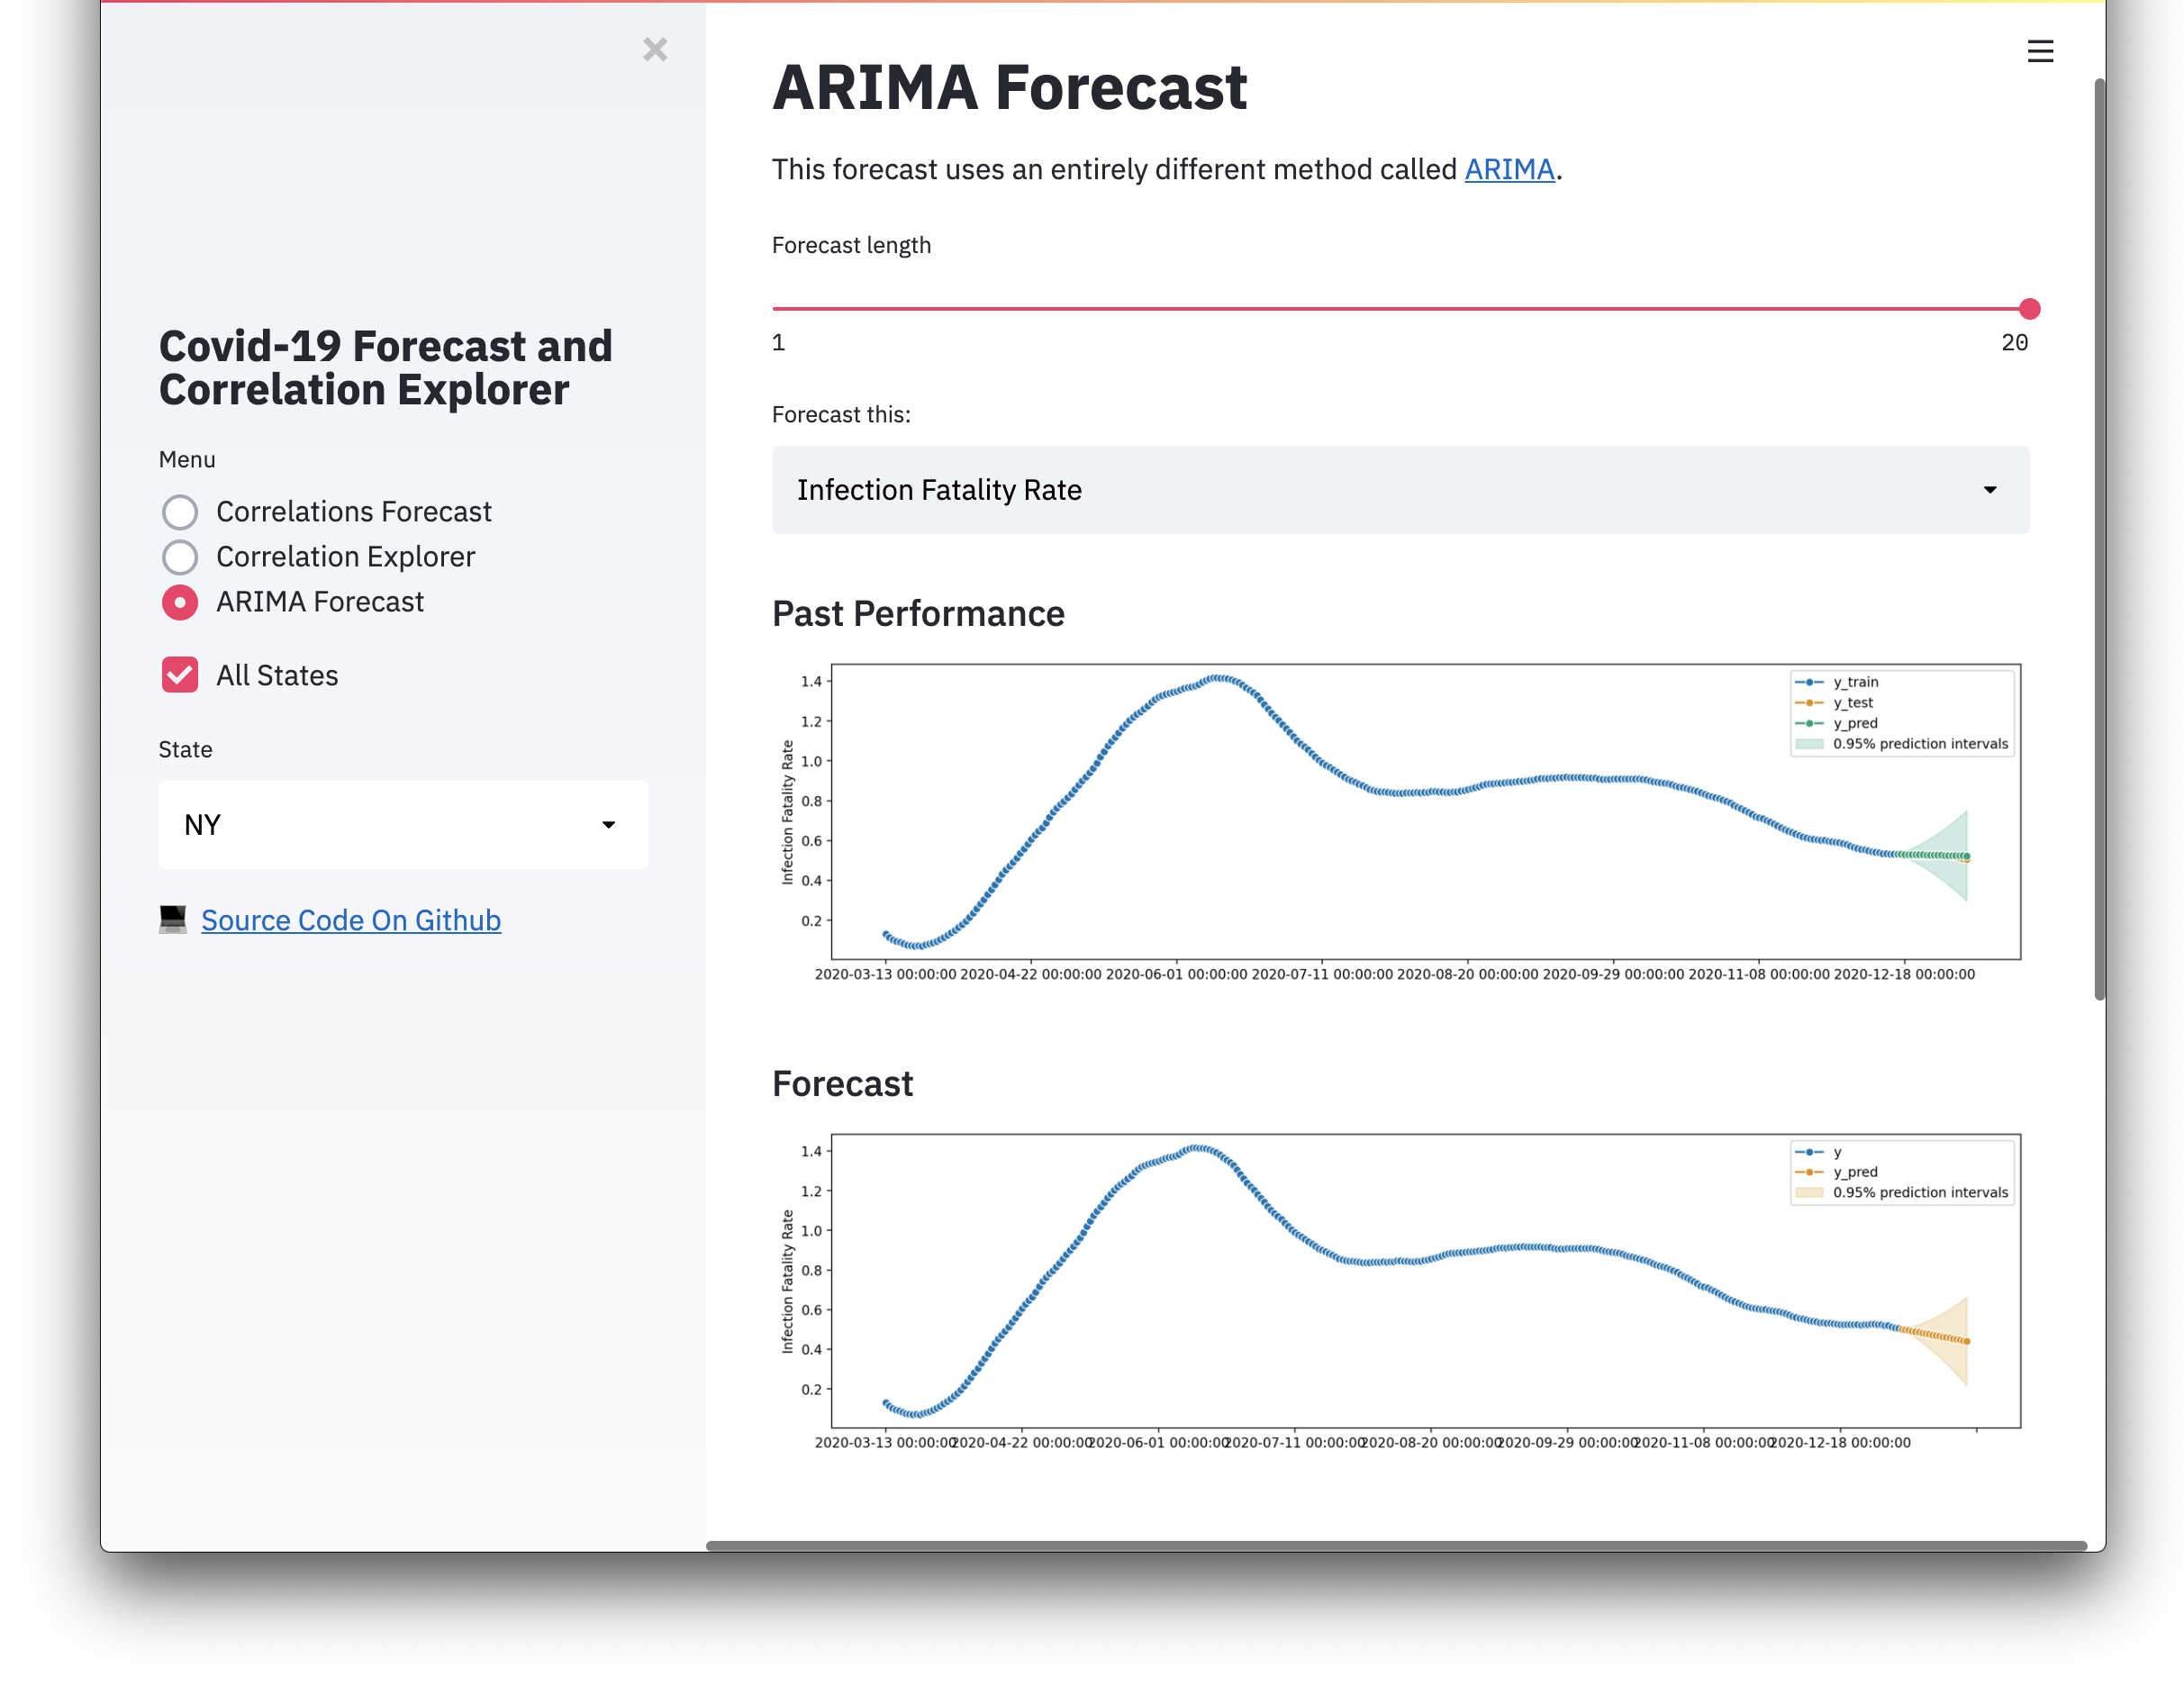
ARIMA forecast -
Try using cointegration instead of correlation
-
Cleanup code
-
Intra-state correlations


