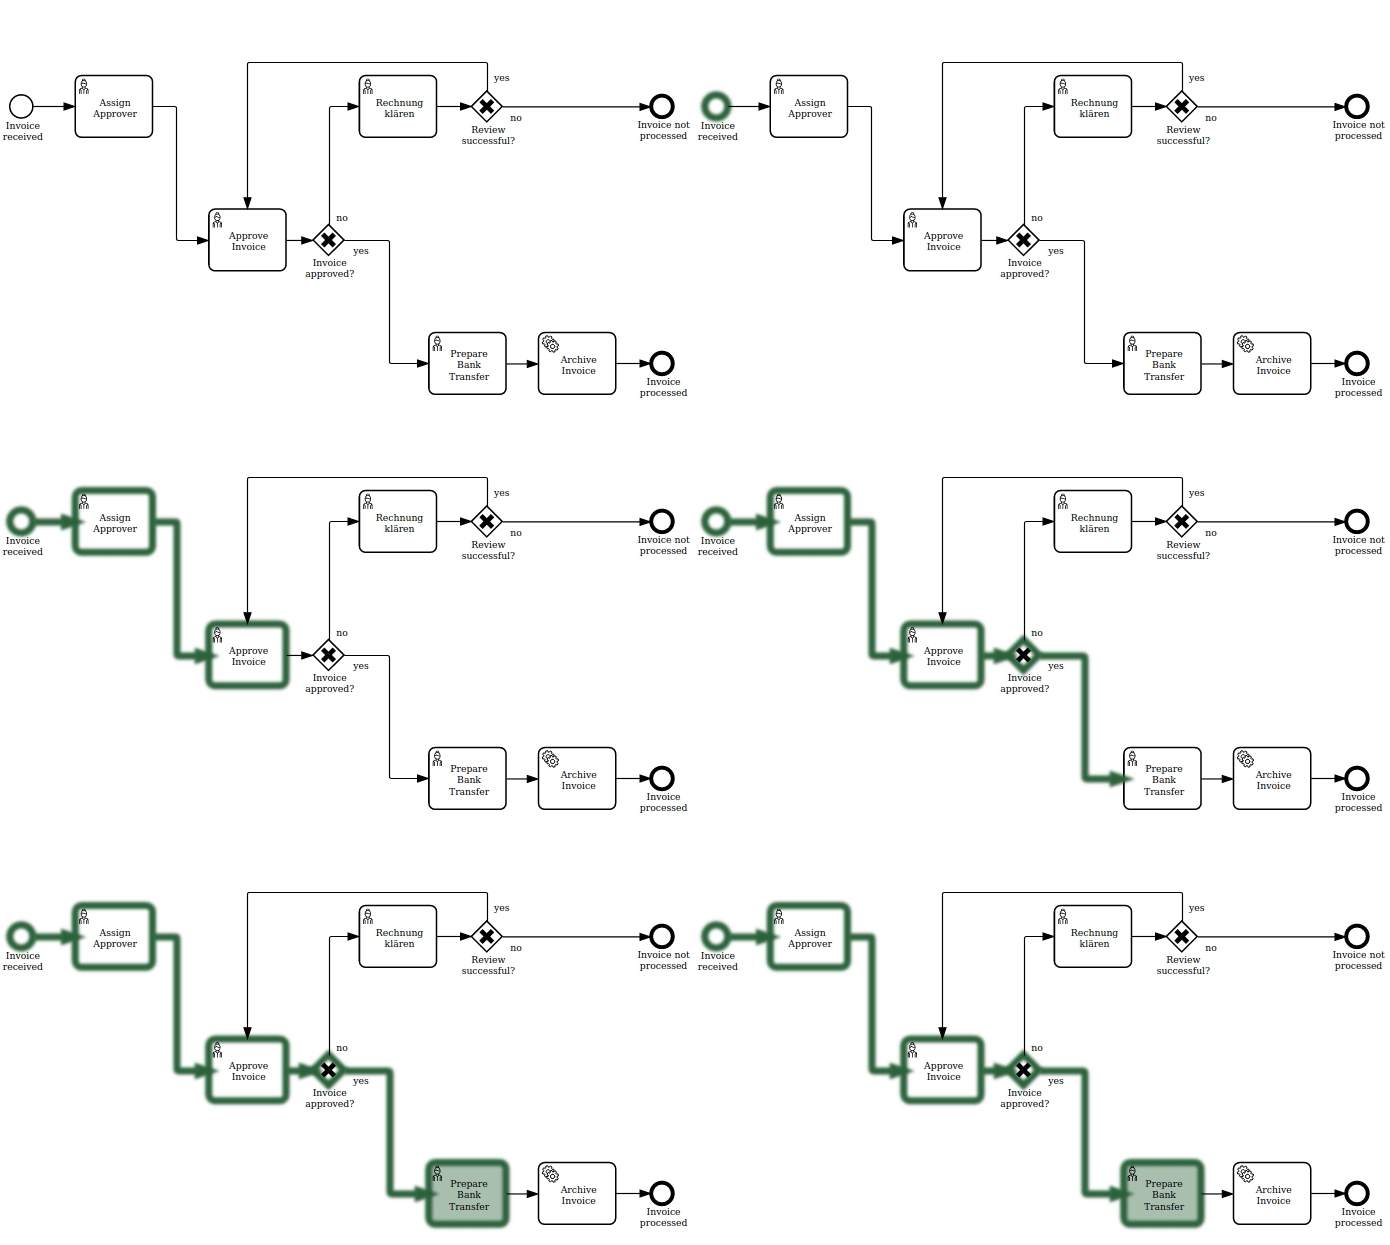
bpmn-visualization is a TypeScript library for visualizing process execution data on BPMN diagrams with:
- additional display options for execution data (highlight some transitions, counters, and more)
- interactive capacities (mouse hover, click)
Please check the ⏩ live environment.
You will find there basic usage as well as detailed examples showing possible rendering customizations.
The bpmn-visualization is in early development stage and is subject to change prior to the 1.0.0 release.
Already available features:
- Supported BPMN Elements.
- Navigate through the BPMN diagram
- Display options for execution data with interactive capacities
Planned features:
- Library extension points
- ✨ True opensource license without watermark display
- ⚡️ Strong identity: the only BPMN viewer with a woman icon in the User Tasks
- 🎸 Fully documented and with a lot of integration examples
- 👓 Highly customizable rendering in a simple way
- 🔥 TypeScript support
- 🎯 Battle tested: high test coverage, thousands of tests, including tests on all supported browsers for Linux, macOS and Windows
We do our best to support recent versions of major browsers
 Chrome Chrome |
 Firefox Firefox |
||
|---|---|---|---|
| ✔️ | ✔️ | ✔️ | ✔️ |
Notes:
- Internet Explorer and Legacy Edge will never be supported.
- Chromium based browsers should work (automatic tests are run with Chromium canary releases). In particular, the following
browsers are known working with
bpmn-visualization@0.23.0:- Brave 1.36.119
- Chromium 100.0.4863.0
- Opera 85.0.4341.18
- The library may work with the other browsers. They must at least support ES6.
The library is available from NPM.
We support various module formats such as:
- IIFE:
dist/bpmn-visualization.js - ESM:
dist/bpmn-visualization.esm.js - CommonJS:
dist/bpmn-visualization.cjs.js
- Install the dependency in your package.json file:
npm i bpmn-visualizationimport { BpmnVisualization } from 'bpmn-visualization';
let bpmnContent; // your BPMN 2.0 XML content
// initialize BpmnVisualization and load the diagram
// 'bpmn-container' is the id of the HTMLElement that renders the BPMN Diagram
const bpmnVisualization = new BpmnVisualization({ container: 'bpmn-container' });
bpmnVisualization.load(bpmnContent);You can set the BPMN content using one of the following ways:
- Copy/Paste directly the XML content in a variable
- Load it from an url, like this example
- Load from your computer, like the demo example
bpmn-visualization provides type definitions, so the integration should work out of the box in TypeScript projects.
Depending on the build system used by the TypeScript project, it may get the following type errors
- error TS2688: Cannot find type definition file for 'typed-mxgraph'
- error TS7016: Could not find a declaration file for module 'mxgraph'
In this case,
- Declare the
typed-mxgraphtypes in thetsconfig.jsonas in the following (see the typeRoots documentation for more explanations) 👇
{
  "compilerOptions": {
    "typeRoots": [
      "node_modules/@types",
      "node_modules/@typed-mxgraph"
    ]
  }
}
Alternatively, you can set skipLibCheck to true in the tsconfig.json file, but this limits the definition checks.
For more details, see the skipLibCheck documentation.
Advanced users that want to extend the mxGraph integration must add typed-mxgraph to typeRoots.
For more details, see the TypeScript projects in the bpmn-visualization-examples repository.
- In the HTML page:
- Load
bpmn-visualization(replace{version}by the recent version) - Define the container that displays the BPMN diagram, here bpmn-container
- Load
    <script src="https://cdn.jsdelivr.net/npm/bpmn-visualization@{version}/dist/bpmn-visualization.min.js"></script>
    ...
<div id="bpmn-container"></div>- Put this Javascript snippet within the HTML page
    let bpmnContent; // your BPMN 2.0 XML content
    // initialize BpmnVisualization and load the diagram
    const bpmnVisualization = new bpmnvisu.BpmnVisualization({ container: 'bpmn-container'});
bpmnVisualization.load(bpmnContent);The User documentation (with the feature list & the public API) is available in the documentation site.
💡 Want to know more about bpmn-visualization usage and extensibility? Have a look at the
⏩ live examples site.
For more technical details and how-to, go to the bpmn-visualization-examples repository.
To contribute to bpmn-visualization, fork and clone this repository locally and commit your code on a separate branch.
Please write tests for your code before opening a pull-request:
npm run test # run all unit & e2e testsYou can find more detail in our Contributing guide. Participation in this open source project is subject to a Code of Conduct.
✨ A BIG thanks to all our contributors 🙂
bpmn-visualization is released under the Apache 2.0 license.
Copyright © 2020-present, Bonitasoft S.A.
Some BPMN icons used by bpmn-visualization are derived from existing projects. See the BPMN Support documentation
for more details:
- draw.io (Apache-2.0)
- flaticon (freepikcompany license)
- noun project (mainly Creative Commons CCBY 3.0)
statically.io (demo and examples live environments)
surge.sh (demo and documentation preview environments)


