🚨 Container images have moved to ghcr.io/chelnak/status-cake-exporter
Status Cake Exporter is a Prometheus exporter for StatusCake.
Metrics are exposed on port 8000 when using the provided examples/manifest.yml](examples/manifest.yml) in Kubernetes, e.g.
http://status-cake-exporter.default.svc:8000- Python 3.7 (not tested with anything below this)
- Python dependencies from
requirements.txt - Docker
- Kubernetes (optional)
- Helm 3 (optional)
| Setting | Required | Default |
|---|---|---|
| USE_V1_UPTIME_ENDPOINTS | No | False |
| USE_V1_MAINTENANCE_WINDOWS_ENDPOINTS | No | False |
| USERNAME | Yes | Null |
| API_KEY | Yes | Null |
| TAGS | No | Null |
| LOG_LEVEL | No | info |
| PORT | No | 8000 |
The following will expose the exporter at localhost:8000:
export USERNAME=statuscakeuser
export API_KEY=xxxxxxxx
docker run -d -p 8000:8000 --env USERNAME --env API_KEY ghcr.io/chelnak/status-cake-exporter:latestTo get up and running quickly, use examples/manifest.yml as an example. You will need to create a secret named status-cake-api-token containing your USERNAME and API_KEY first.
Otherwise, you can use the Helm Chart provided in chart/status-cake-exporter.
To get up and running quickly, use examples/grafana-example.json as an example.
usage: app.py [-h] [--username USERNAME] [--api-key API_KEY]
              [--tests.tags TAGS] [--logging.level {debug,info,warn,error}] [--port PORT]

If an arg is specified in more than one place, then commandline values
override environment variables which override defaults.

optional arguments:
  -h, --help            show this help message and exit
  --use_v1_uptime_endpoints true                Boolean for using v1 uptime endpoints [env var: USE_V1_UPTIME_ENDPOINTS]
  --use_v1_maintenance_windows_endpoints true   Boolean for using v1 maintenance windows endpoints [env var: USE_V1_MAINTENANCE_WINDOWS_ENDPOINTS]
  --username USERNAME   Username for the account [env var: USERNAME]
  --api-key API_KEY     API key for the account [env var: API_KEY]
  --tests.tags TAGS     A comma separated list of tags used to filter tests returned from the api [env var: TAGS]
  --logging.level       {debug,info,warn,error} Set a log level for the application [env var: LOG_LEVEL]
--port The TCP port to start the web server on [env var: PORT]StatusCake have a new v1 API with documentation available at https://www.statuscake.com/api/v1/, deprecating the legacy API https://www.statuscake.com/api/.
The new Get all uptime tests endpoint https://www.statuscake.com/api/v1/#operation/list-uptime-tests provides paged responses to get all tests, overcoming the limit of only 100 tests in the response from the legacy API https://www.statuscake.com/api/Tests/Get%20All%20Tests.md
Environment variables USE_V1_UPTIME_ENDPOINTS and USE_V1_MAINTENANCE_WINDOWS_ENDPOINTS are used to enable use of the v1 API.
Endpoints of the new v1 API are available to be used by all accounts with the exception of the maintenance windows endpoints, from https://www.statuscake.com/api/v1/#tag/uptime:
NOTE: the API endpoints concerned with maintenance windows will only work with accounts registed to use the newer version of maintenance windows. This version of maintenance windows is incompatible with the original version and all existing windows will require migrating to be further used. Presently a tool to automate the migration of maintenance windows is under development. Similarly, if an account is registered to use the newer version of maintenance windows, the legacy API's maintenance windows endpoints cannot be used.
| Name | Type | Description |
|---|---|---|
| status_cake_test_info | Gauge | A basic listing of the tests under the current account. |
| status_cake_test_uptime_percent | Gauge | Tests and their uptime percentage |
Prometheus config needs to be updated in order to see the new exported. Use the following scrape config as an example:
scrape_configs:
    - job_name: status-cake-exporter
    honor_timestamps: true
    scrape_interval: 10m
    scrape_timeout: 1m
    metrics_path: /
    scheme: http
    static_configs:
    - targets:
- status-cake-exporter.default.svc:8000Data collected by Prometheus can be easily surfaced in Grafana.
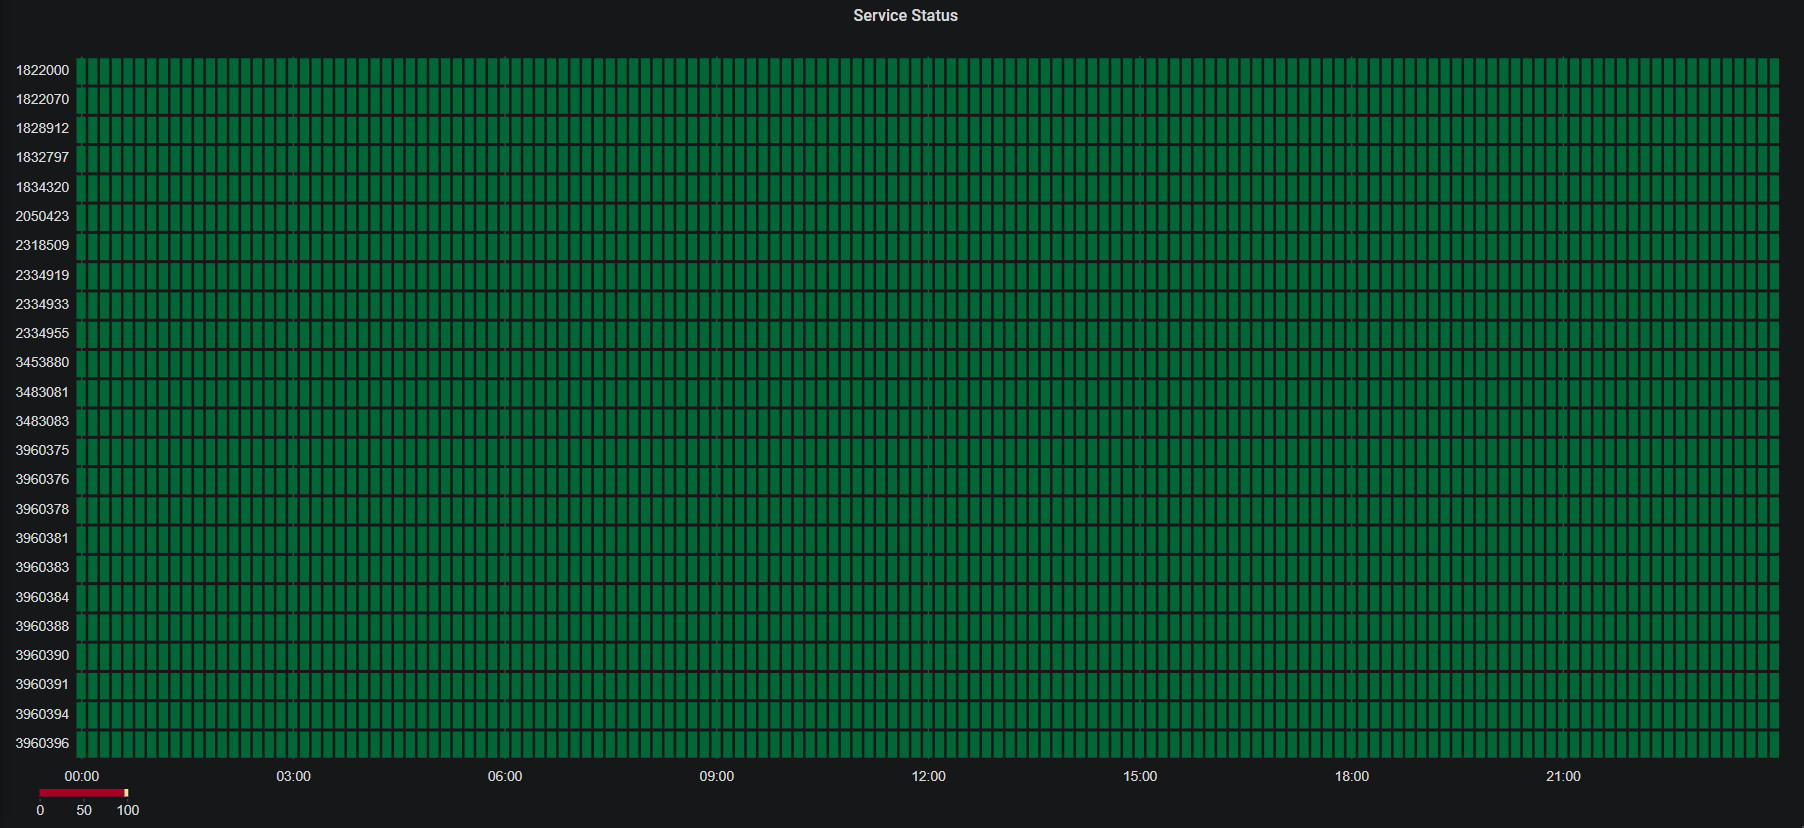
Using the Statusmap panel by flant you can create a basic status visualization based on uptime percentage:
status_cake_test_info * on(test_id) group_right(test_name) status_cake_test_uptime_percent
This repository uses Tilt for rapid development on Kubernetes.
To use this, run:
cd chart/status-cake-exporter
tilt up
Tilt will reload your environment when it detects changes to your code.
Note: You will need to provide valid credentials for StatusCake in your Tiltfile for this to work.
