An experimental command line debugger for Salesforce Commerce Cloud. This provides an interface similar to pdb debugger for python.
Download/clone the repository & run npm install to install the dependencies. Node version 10.x or greater is required.
Before starting to debug it is important to configure the debugger. The debugger configuration is part of dw.json and config.js file under config folder.
dw.json is the standard file which is used by various other SFCC tools. Add your instance hostname & credentials in it.
config.js is a custom configuration file. See config/config.js.sample for possible options.
Out of the box debugger supports two kinds of workspace setups.
In this setup all cartridges are under /cartridges/ and under one parent folder as shown below.
>> ~/clone/dummy_folder/storefront-reference-architecture
├── bin
├── cartridges
│   ├── app_storefront_base
│   ├── bm_app_storefront_base
│   └── modules
│   └── plugin_ratings
│   └── plugin_wishlist
│   └── int_klarna
└── test
    ├── acceptance
    ├── integration
    ├── mocks
    └── unit
This setup is quite easy to configure using rootWorkSpacePath property.
In config.js configure rootWorkSpacePath as /my_user/home/path/till/cartridges/. So, for above example this will be /Users/username/clone/dummy_folder/storefront-reference-architecture/cartridges
This setup is similar to above but supports a hierarchy. This setup is best shown via below example.
>> ~/clone/dummy_folder
.
├── integrations
│   └── link_klarnacheckout
│       ├── cartridges
│       │   ├── int_klarna_checkout
│       │   ├── int_klarna_checkout_core
│       │   └── int_klarna_checkout_sfra
├── plugins
│   ├── plugin_ratings
│   │   └── cartridges
│   │       └── plugin_ratings
│   └── plugin_wishlists
│       ├── cartridges
│       │   └── plugin_wishlists
└── storefront-reference-architecture
    ├── cartridges
    │   ├── app_storefront_base
    │   ├── bm_app_storefront_base
    │   └── modules
The above setup requires additional setup in config.js file.
rootWorkSpacePath - Configure this with the path of the parent folder which contains all your cartridges. So, in above example this would be /Users/username/clone/dummy_folder
childWorkSpaces - Configure this with the path of individual folders. So, in above example this would be
        childWorkSpaces: [
            '/Users/username/clone/dummy_folder/integrations',
            '/Users/username/clone/dummy_folder/plugins',
            '/Users/username/clone/dummy_folder/storefront-reference-architecture'
        ]
        ...
Any other setup like folders not sharing a common parent folder will work similar to setup #2 but interactive breakpoint feature which relies on single/common root path rootWorkSpacePath will not work as expected but you can always setup breakpoint manually by specifying the script path.
        rootWorkSpacePath: '/Users/username/some/random/path/1'
        childWorkSpaces: [
            '/Users/username/some/random/path/1',
            '/Users/username/some/random/path/2',
            '/Users/username/some/random/path/3'
        ]
...Debugger is based on the node repl module.
Run the debugger script with below command.
node debug.js
sfcc-cli-debug >
Debugger also support multiple configurations i.e. you can maintain different configurations per project and supply it at runtime through cli parameters. If no parameters are specified debugger fallbacks to standard dw.json and config.js file names.
node debug.js --dwconfig ./config/dw.json --config ./config/config.jsAfter running the above command you will enter into a custom repl prompt sfcc-cli-debug. The commands recognized by the debugger are listed in the help section (.help).
Commands that the debugger prompt doesn't recognize are assumed to be SFCC code statements and are executed in the context of the program being debugged against SFCC server.
sfcc-cli-debug > .help
.start    Attach a Debugger Client
.stop     Detach a Debugger Client
.b        Add a breakpoint
.break    Alias : Add a breakpoint
.bi       Add a breakpoint interactively
.sbr      Add a breakpoint and resume/continue
.tbr      Add a breakpoint temporarily and resume/continue
.ct       Get current thread
.v        Get Variables in scope
.m        Get members of variables
.l        print source code
.si       Step Into
.sn       Step Over/Next to next line
.so       Step Out
.r        Resume and halt at next breakpoint
.p        Evaluate On Server and print expression value
.gb       Display all breakpoints
.rb       remove breakpoint(s)
.save     Save the debugger state (breakpoints) into a file
.restore  Restore/Add the breakpoints
.exit Exit the replUse this command to connect/attach the debugger to your sandbox. This should be first command you run before starting the debugging session
sfcc-cli-debug > .start
Debugger listening on server
sfcc-cli-debug >Use this command to stop the debugger connected/attached to your sandbox.
sfcc-cli-debug > .stop
Debugger disconnected from server
sfcc-cli-debug >.ct command can be used to see at which location debugger is currently halted. This command can also be used to check if debugger is hit or not.
Once your debugger is connected it is time to add breakpoint. There are two ways to add a breakpoint
Use command .b lineNumber,scriptPath or .break lineNumber,scriptPath
lineNumber - line number where breakpoint will be added
scriptPath - Location of the .ds or .js file. This path should be after the /cartridges folder and is an absolute path with leading /.
sfcc-cli-debug > .break 17,/app_storefront_controllers/cartridge/controllers/Home.js
Breakpoint successfully set on server at line# 17
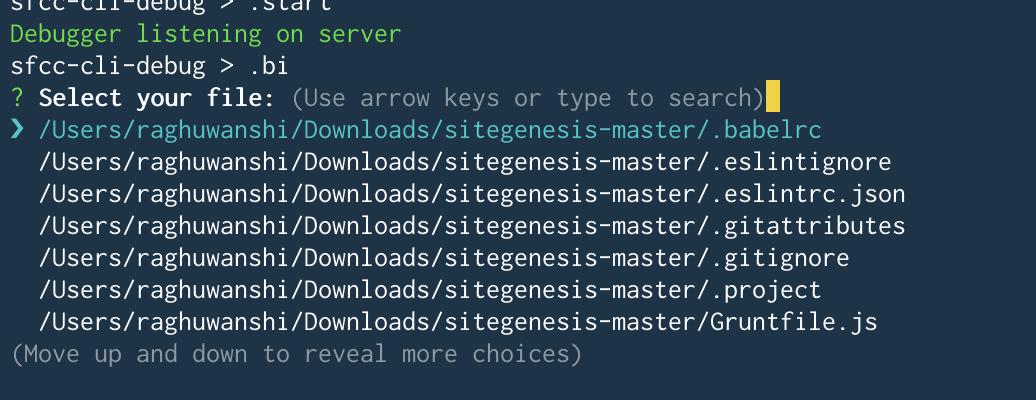
sfcc-cli-debug >Use command .bi and it will open an interactive prompt. In this prompt you can search(fuzzy) & select the file of your choice.
After the file is selected you will be asked for lineNumber where breakpoint should be added.
It is not always an easy experience in cli, when while debugging you have to set breakpoints at multiple locations in the same file.
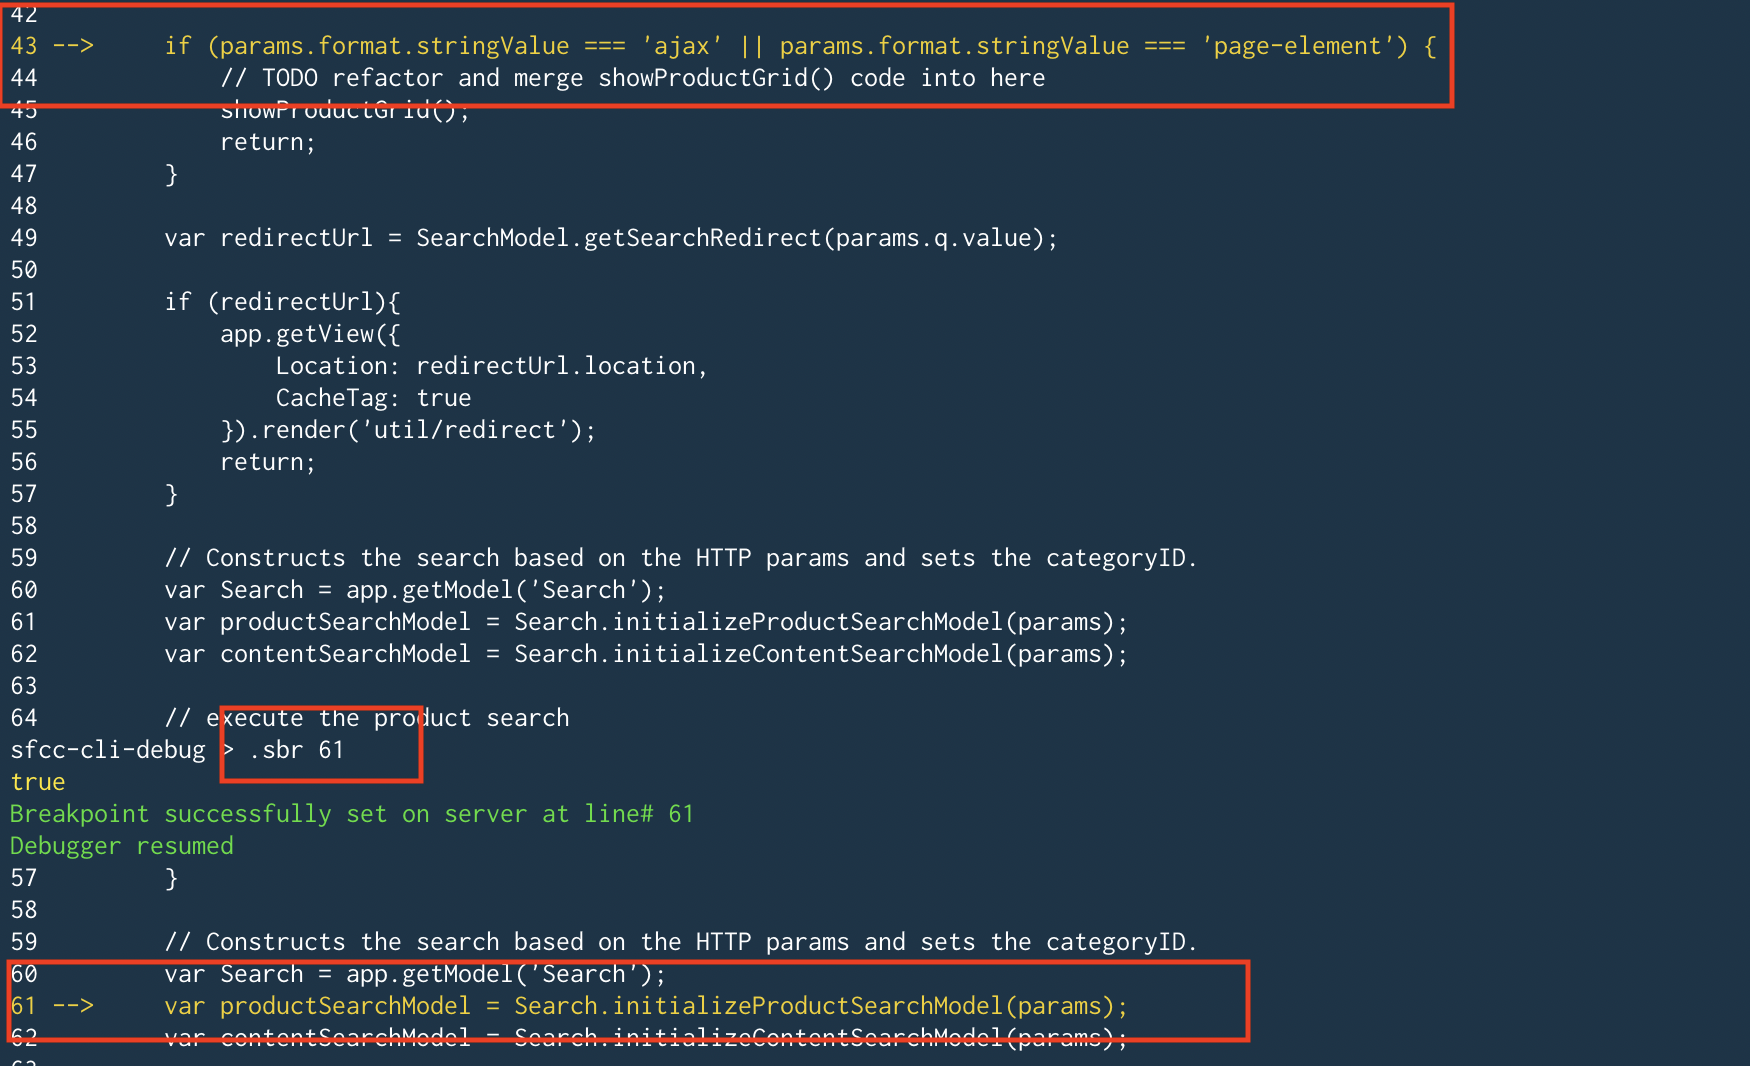
In order to make this a bit easy you can use the .sbr lineNumber or .tbr lineNumbercommand.
.sbr and .tbr command takes only one argument the lineNumber. Script Path is assumed to be the current script where debugger is halted.
In this command debugger is also automatically resumed(.r) to the new breakpoint location.
Difference between .sbr and .tbr is that .tbr sets the breakpoint temporarily(t) i.e. once debugger is resumed to that particular location it will silently remove the breakpoint.
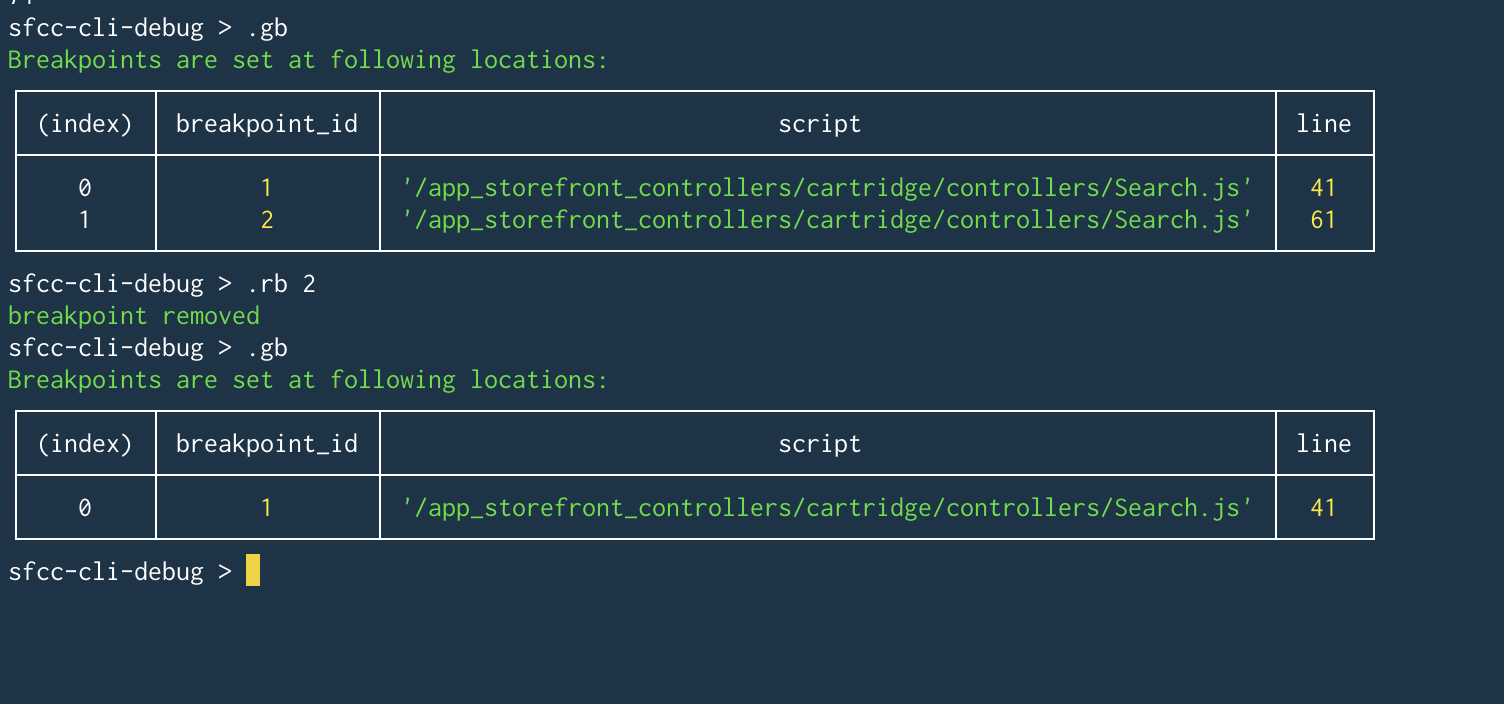
.gb command can be used to list down all the breakpoints added on server
.rb command can be used to remove the breakpoints on the server. It takes an additional argument breakpoint id if a specific breakpoint has to be removed. If not specified all breakpoints are removed.
breakpoint id is returned as the response of .gb command
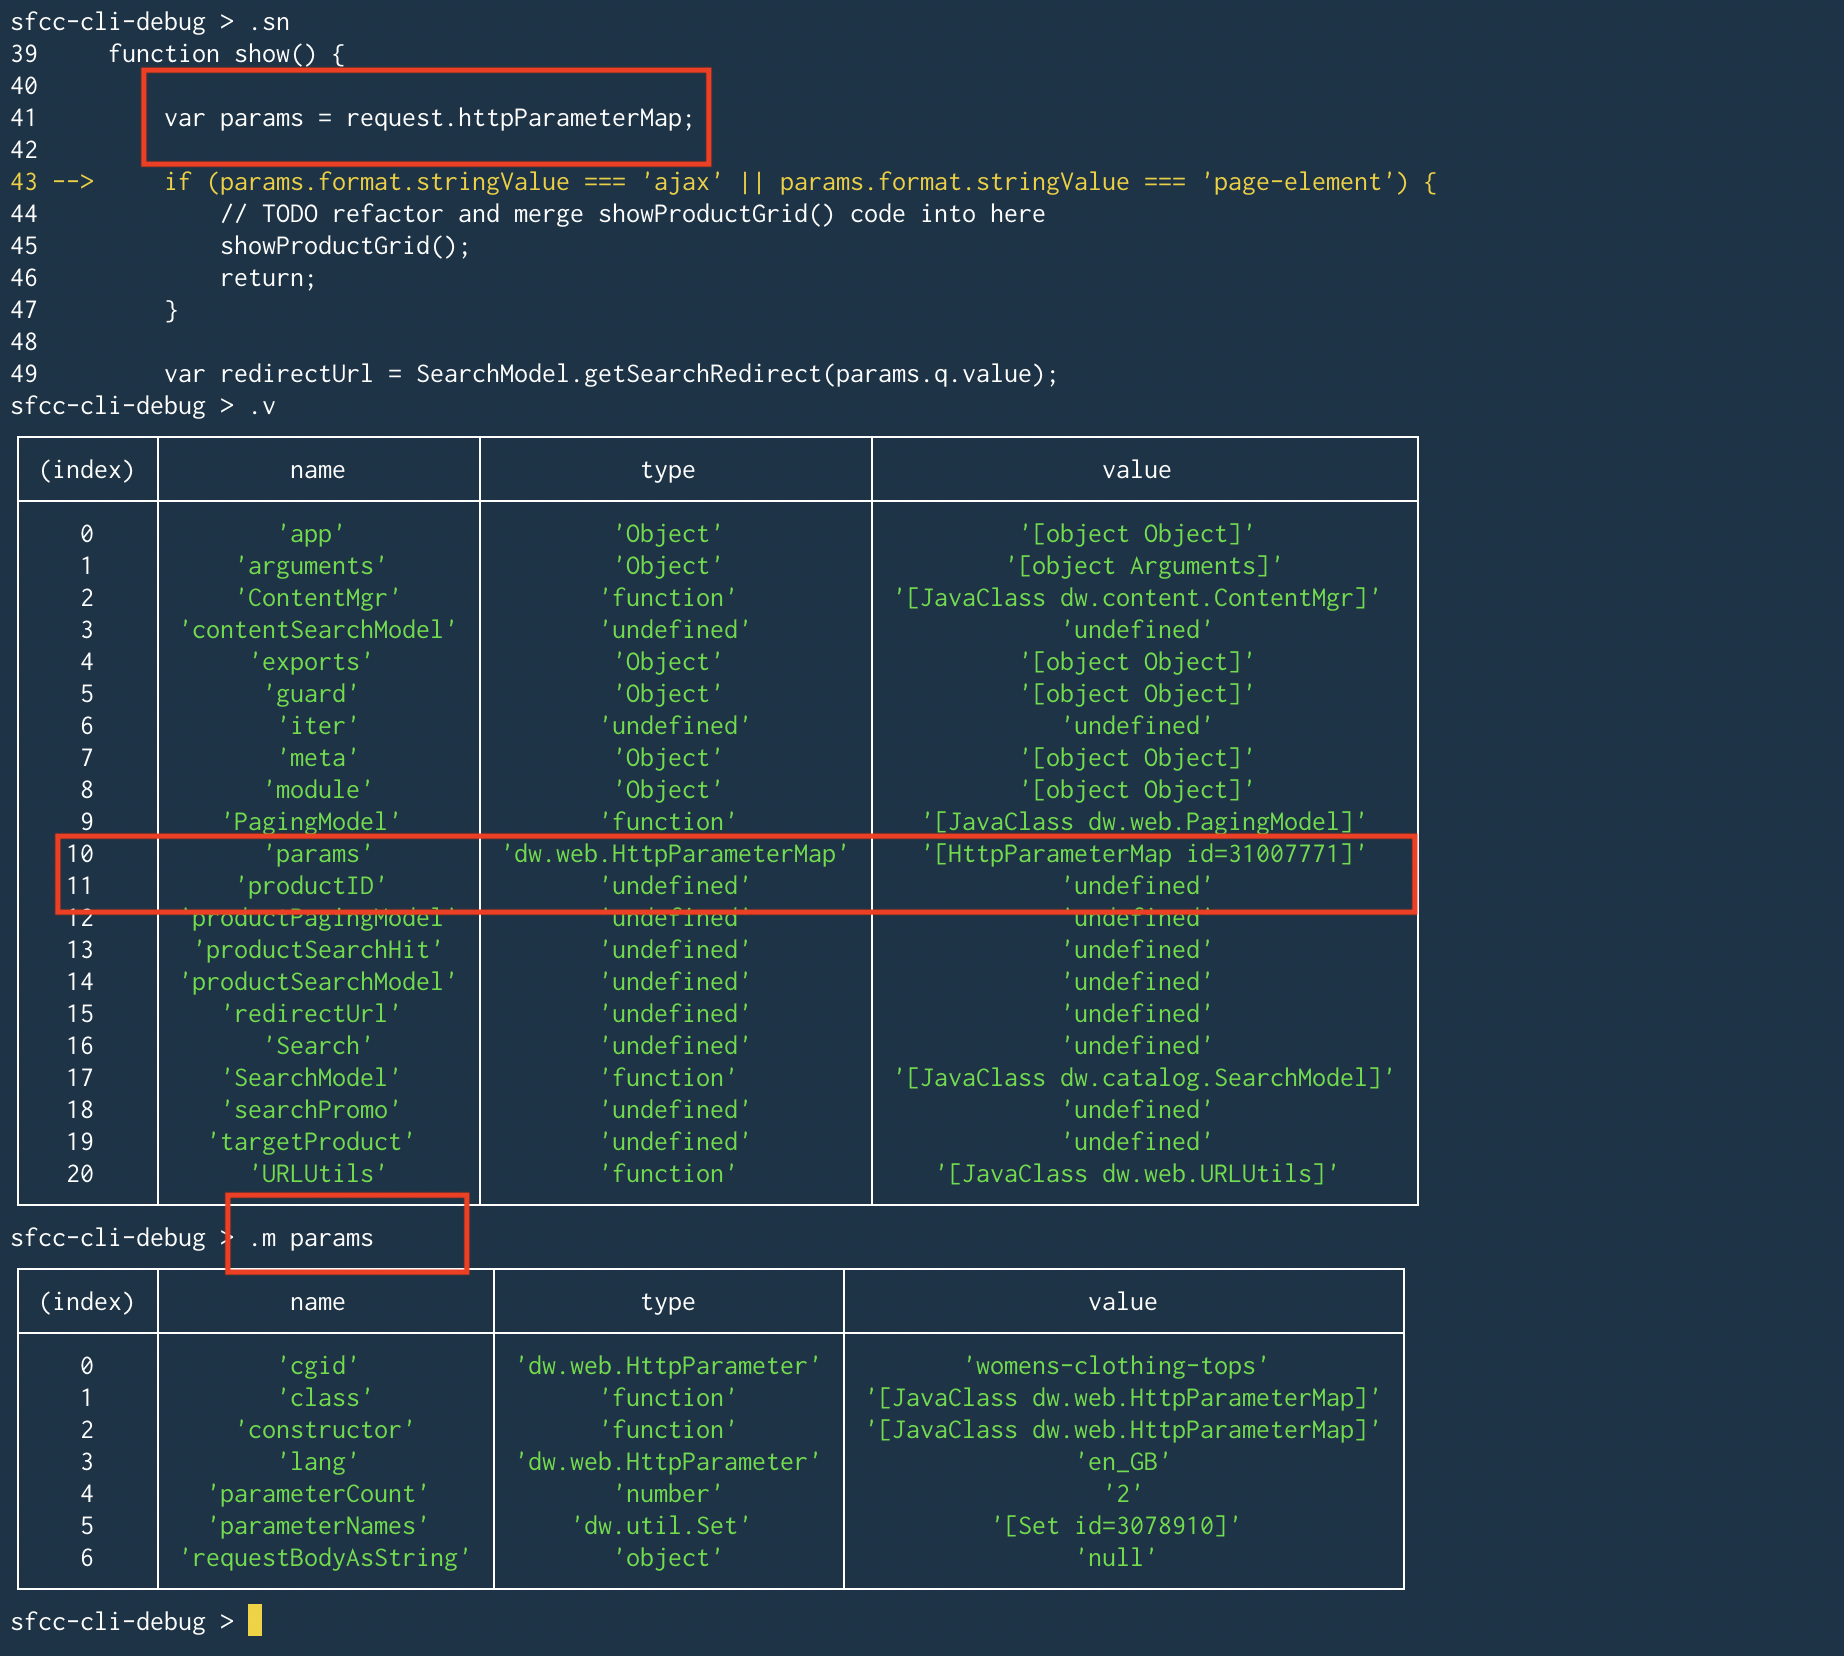
Debugging experience without inspecting the variables & their current values in scope is no fun. So, .v command can be used to get all the variables currently in scope.
.v commands return the variables but if you want to drill down further into a variable and it's properties use .m variable_name command. This command can be used recursively i.e. .m variable_name.property_1
These are standard debugger command to step next, over & into.
.sn - Step Next/Over to the next line in the script.
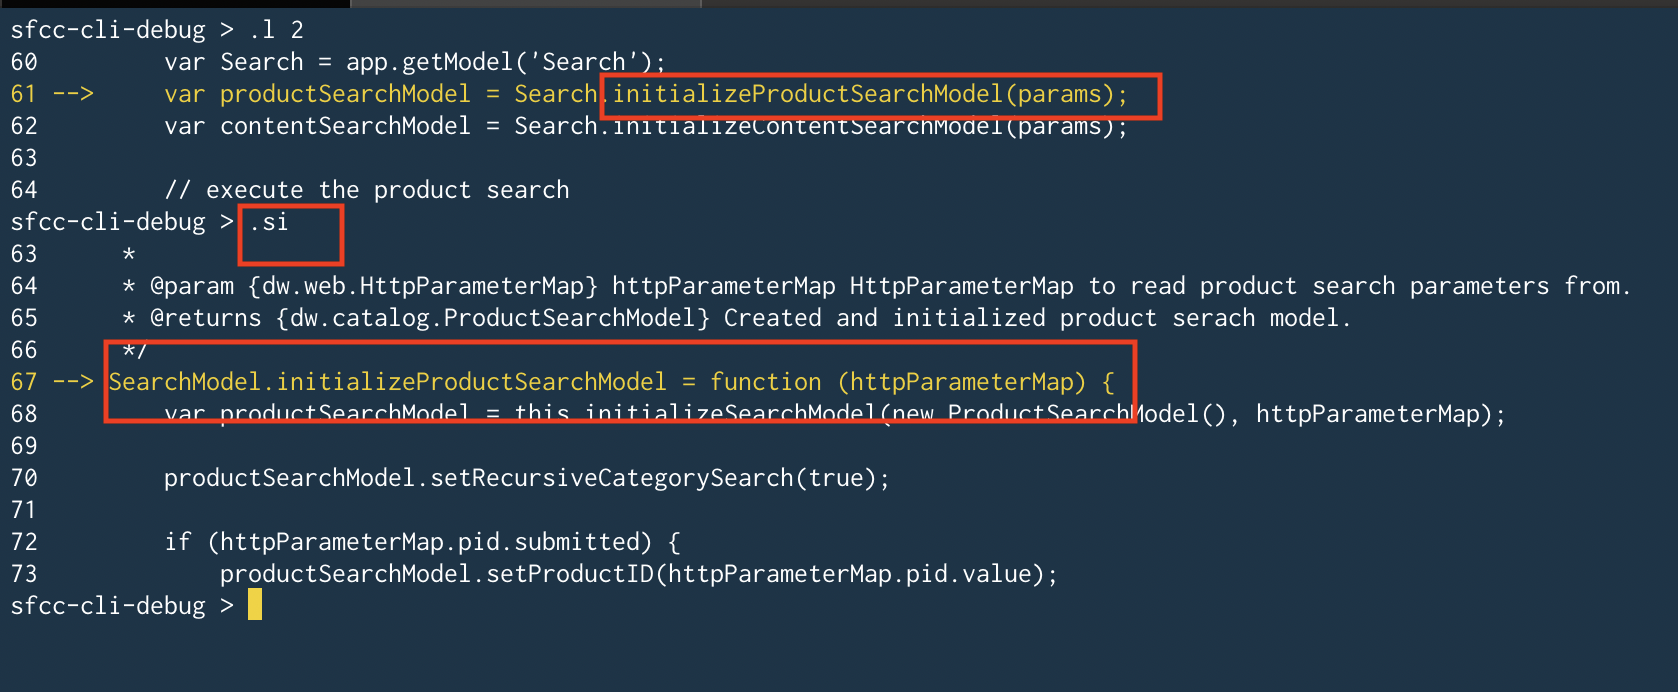
.si - Step into the function at the current location.
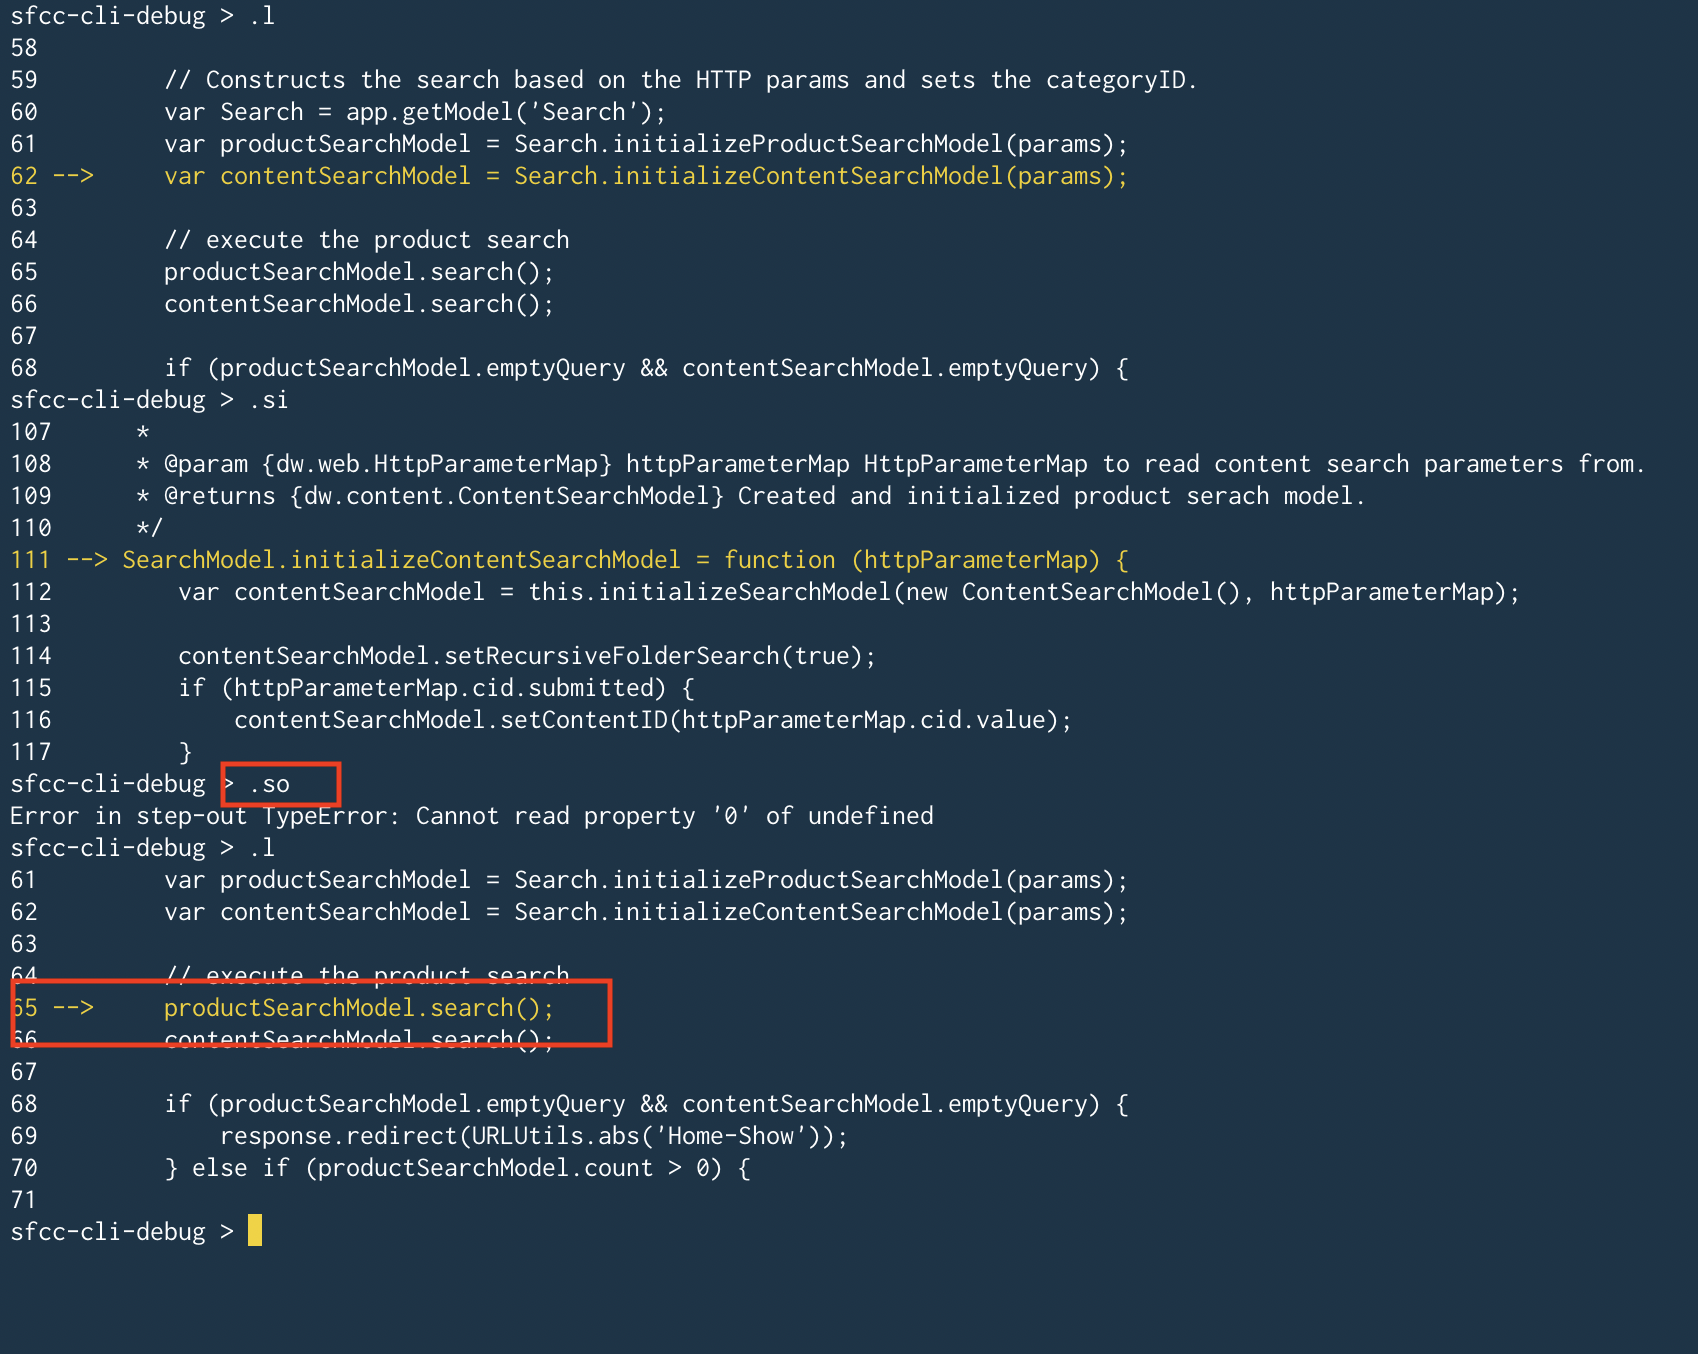
.so - Step out of the current location & return to parent
.r - Resume to the next breakpoint location. If no next breakpoint location is found release the debugger.
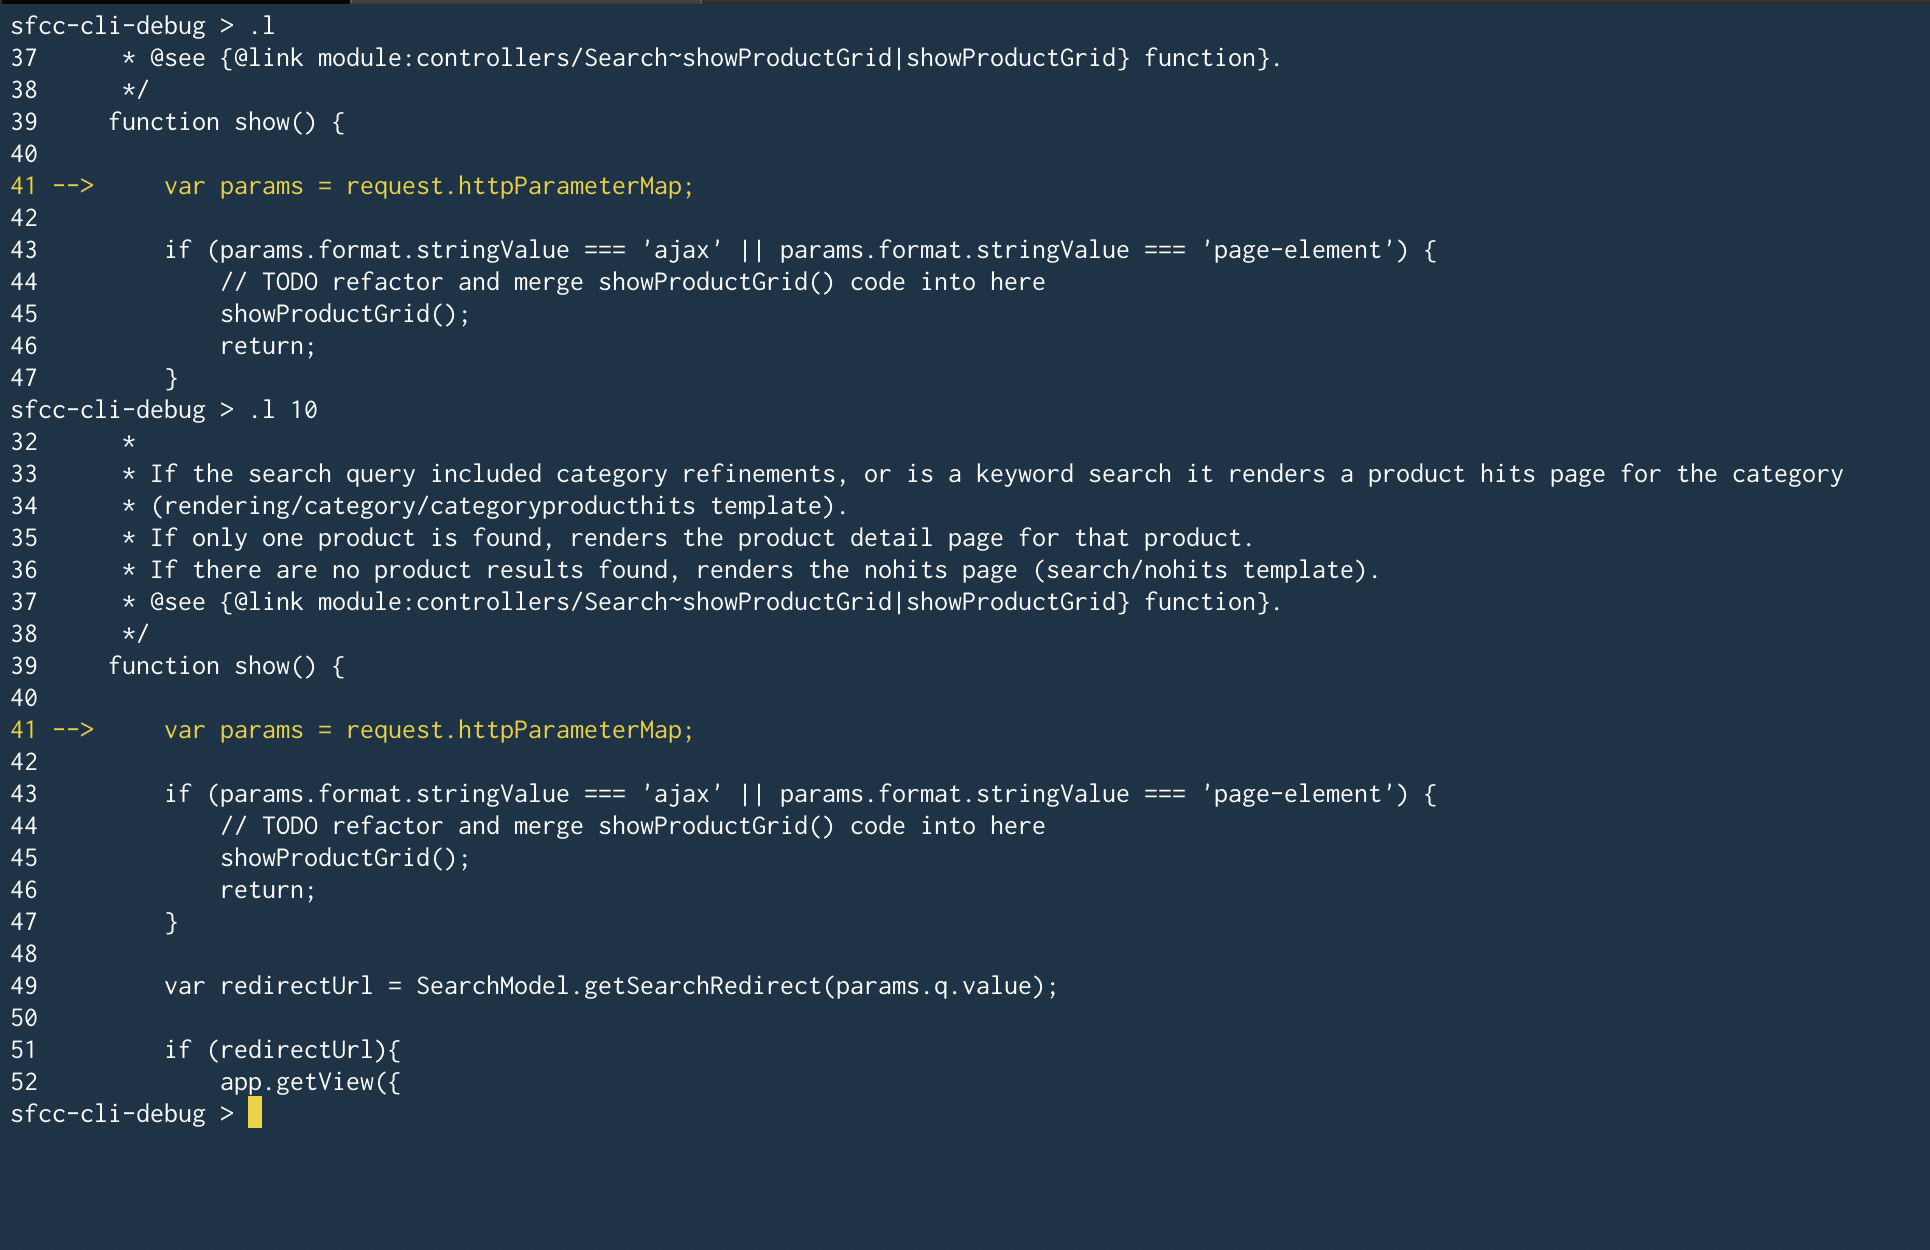
Helper function to print the lines of code.
.l offset - if no offset is specified 5 lines around(above/below) the current breakpoint location are displayed in the terminal.
Current location where debugger is halted is highligted with --> and a yellow color.
.p expression can be used to evaluate an expression in real-time on SFCC server.
Debugger also supports evaluating command by directly entering it on the terminal.
This functionality can be used to save the debugger state(breakpoints) into a file. Breakpoints can be restored at a later stage. This is useful when a debugger crashes in between or program crashes for whatever reasons. In this scenarios you can save the debugger state and exit the program.
.exit is a standard repl command to exit out of the repl. .exit will also stop the debugger and release all breakpoint from the server
| Command | Purpose |
|---|---|
| .start | Start the debugger session |
| .stop | Stops the debugger session and release/delete all breakpoints |
| .b .break | Add a breakpoint at the specified lineNumber & scriptPath |
| .bi | Add a breakpoint interactively |
| .ct | Check at which location debugger is currently halted |
| .sbr | Add a breakpoint at specified lineNumber & resume the debugger to newly added breakpoint |
| .tbr | Add a breakpoint temporarily at specified lineNumber & resume the debugger to newly added breakpoint |
| .gb | Get all breakpoints |
| .rb | Remove all breakpoints or a specific breakpoint |
| .v | Get all variables in scope of the current script |
| .m | Get all member objects for the specified variables |
| .sn | Step next/over to the next line |
| .si | Step into the function |
| .so | Step out |
| .r | Resume to the next breakpoint location. If no next breakpoint location is found release the debugger. |
| .l | print source code in terminal |
| .p | Evaluate the expression in real-time and print its result |
| .save | Save the debugger state (breakpoints) into a file |
| .restore | Restore/Add the breakpoints |

