Power Variability on GPUs
- 1. Getting started
- 2. Experimental assumptions
- 3. Characterization
- 4. Handy Nvidia GPU commands
- 5. Notes
1. Getting started
- Setup CUDA on cloud machines. Command reference
- [Optional] If on CloudLab, setup storage using Command reference
- Run
maketo compile cuda files gen_data 25536to generate matrices for SGEMM- Standalone:
./sgemm 25536 1 0or use one of the run*.sh scripts to orchestrate parallel runs - For simultaneous runs, setup noise workloads as outlined below and use the launch scripts
2. Experimental assumptions
- We designed the experiment space accounting for two things: statistical variation (taking mean between runs) and power variation (actual variation in system parameters we are trying to observe)
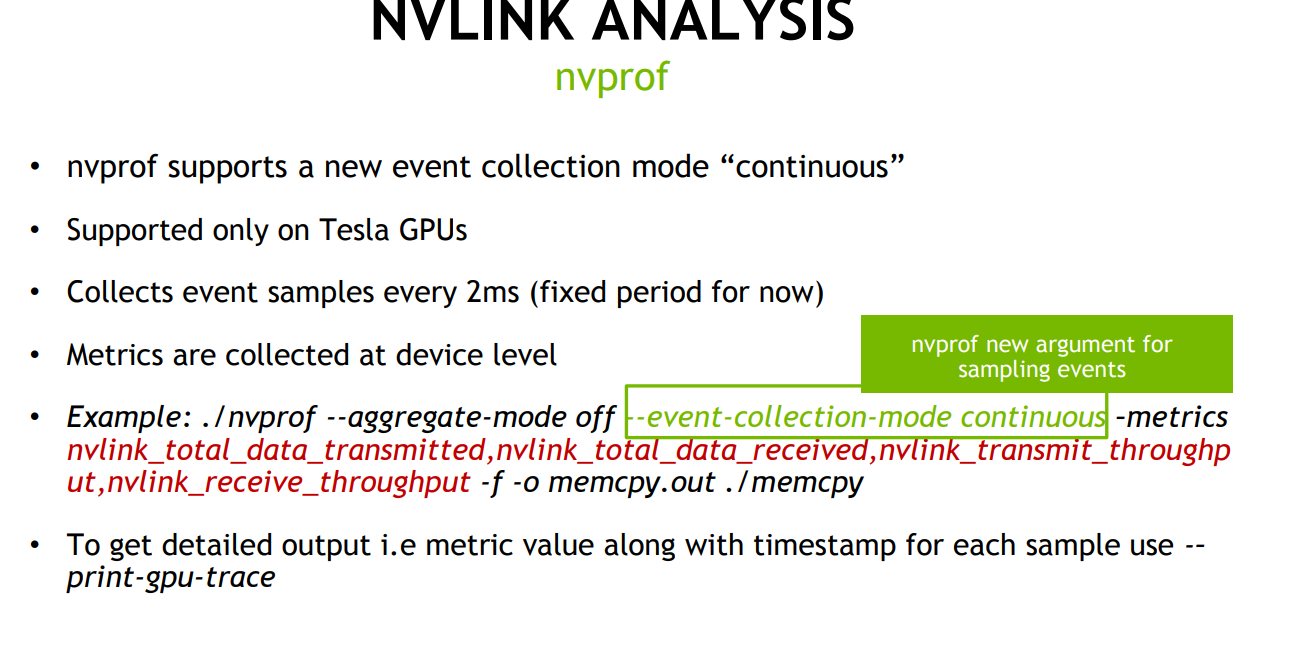
- Run nvprof on all to ensure the same overheads across GPUs. Also, nvprof continuous collection does not capture kernel details running on other GPUs but still captures temperature, frequency, voltage on other GPUs
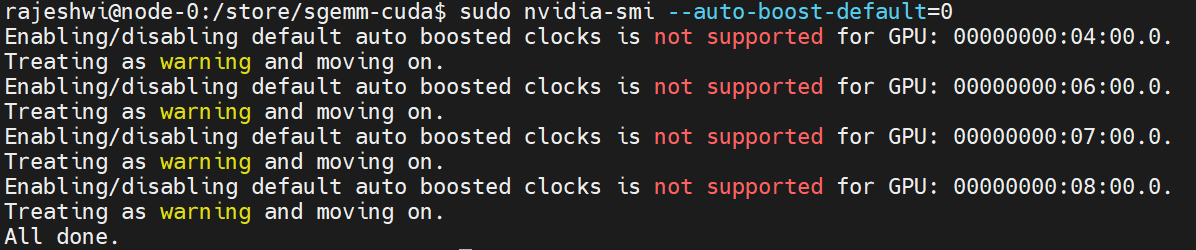
- V100 does not support disabling autoboost. We observed overshoot about 300W upto 325W in many cases.

3. Characterization
3.1. Base workload: SGEMM
CUDA version of a sgemm kernel is included in this repository
Compile sgemm and gen_data using:
make
Before you run the kernel you need to generate the data using the following:
gen_data <square matrix dimension>
The compiled binary can be run from the command line as follows:
sgemm <square matrix dimension> <number of repetitions> <target GPU Id>
Profiling:
- On V100, where nvprof is supported to get system metrics
nvprof --print-gpu-trace --event-collection-mode continuous --system-profiling on --kernel-latency-timestamps on --csv --log-file sgemm_test.csv --device-buffer-size 128 --continuous-sampling-interval 1 -f ./sgemm 2 1 0 - To get metrics such as utilization for the sgemm kernel, do not use event-collection-mode
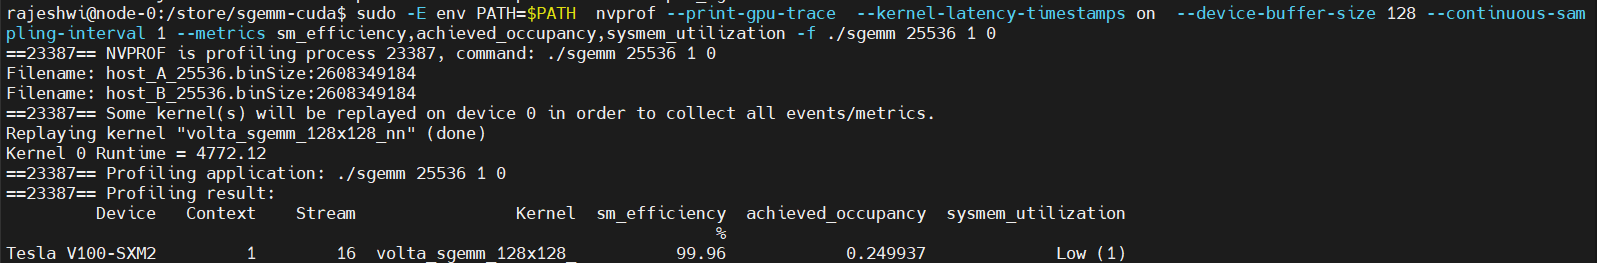
sudo -E env PATH=$PATH nvprof --print-gpu-trace --kernel-latency-timestamps on --device-buffer-size 128 --continuous-sampling-interval 1 --metrics sm_efficiency,achieved_occupancy,sysmem_utilization -f ./sgemm 2 1 0 - On Ampere/Turing where nvprof is not directly supported
nsys nvprof sudo -E env PATH=$PATH nvprof --profile-from-start off --log-file test sgemm 2 1 0
Insights:
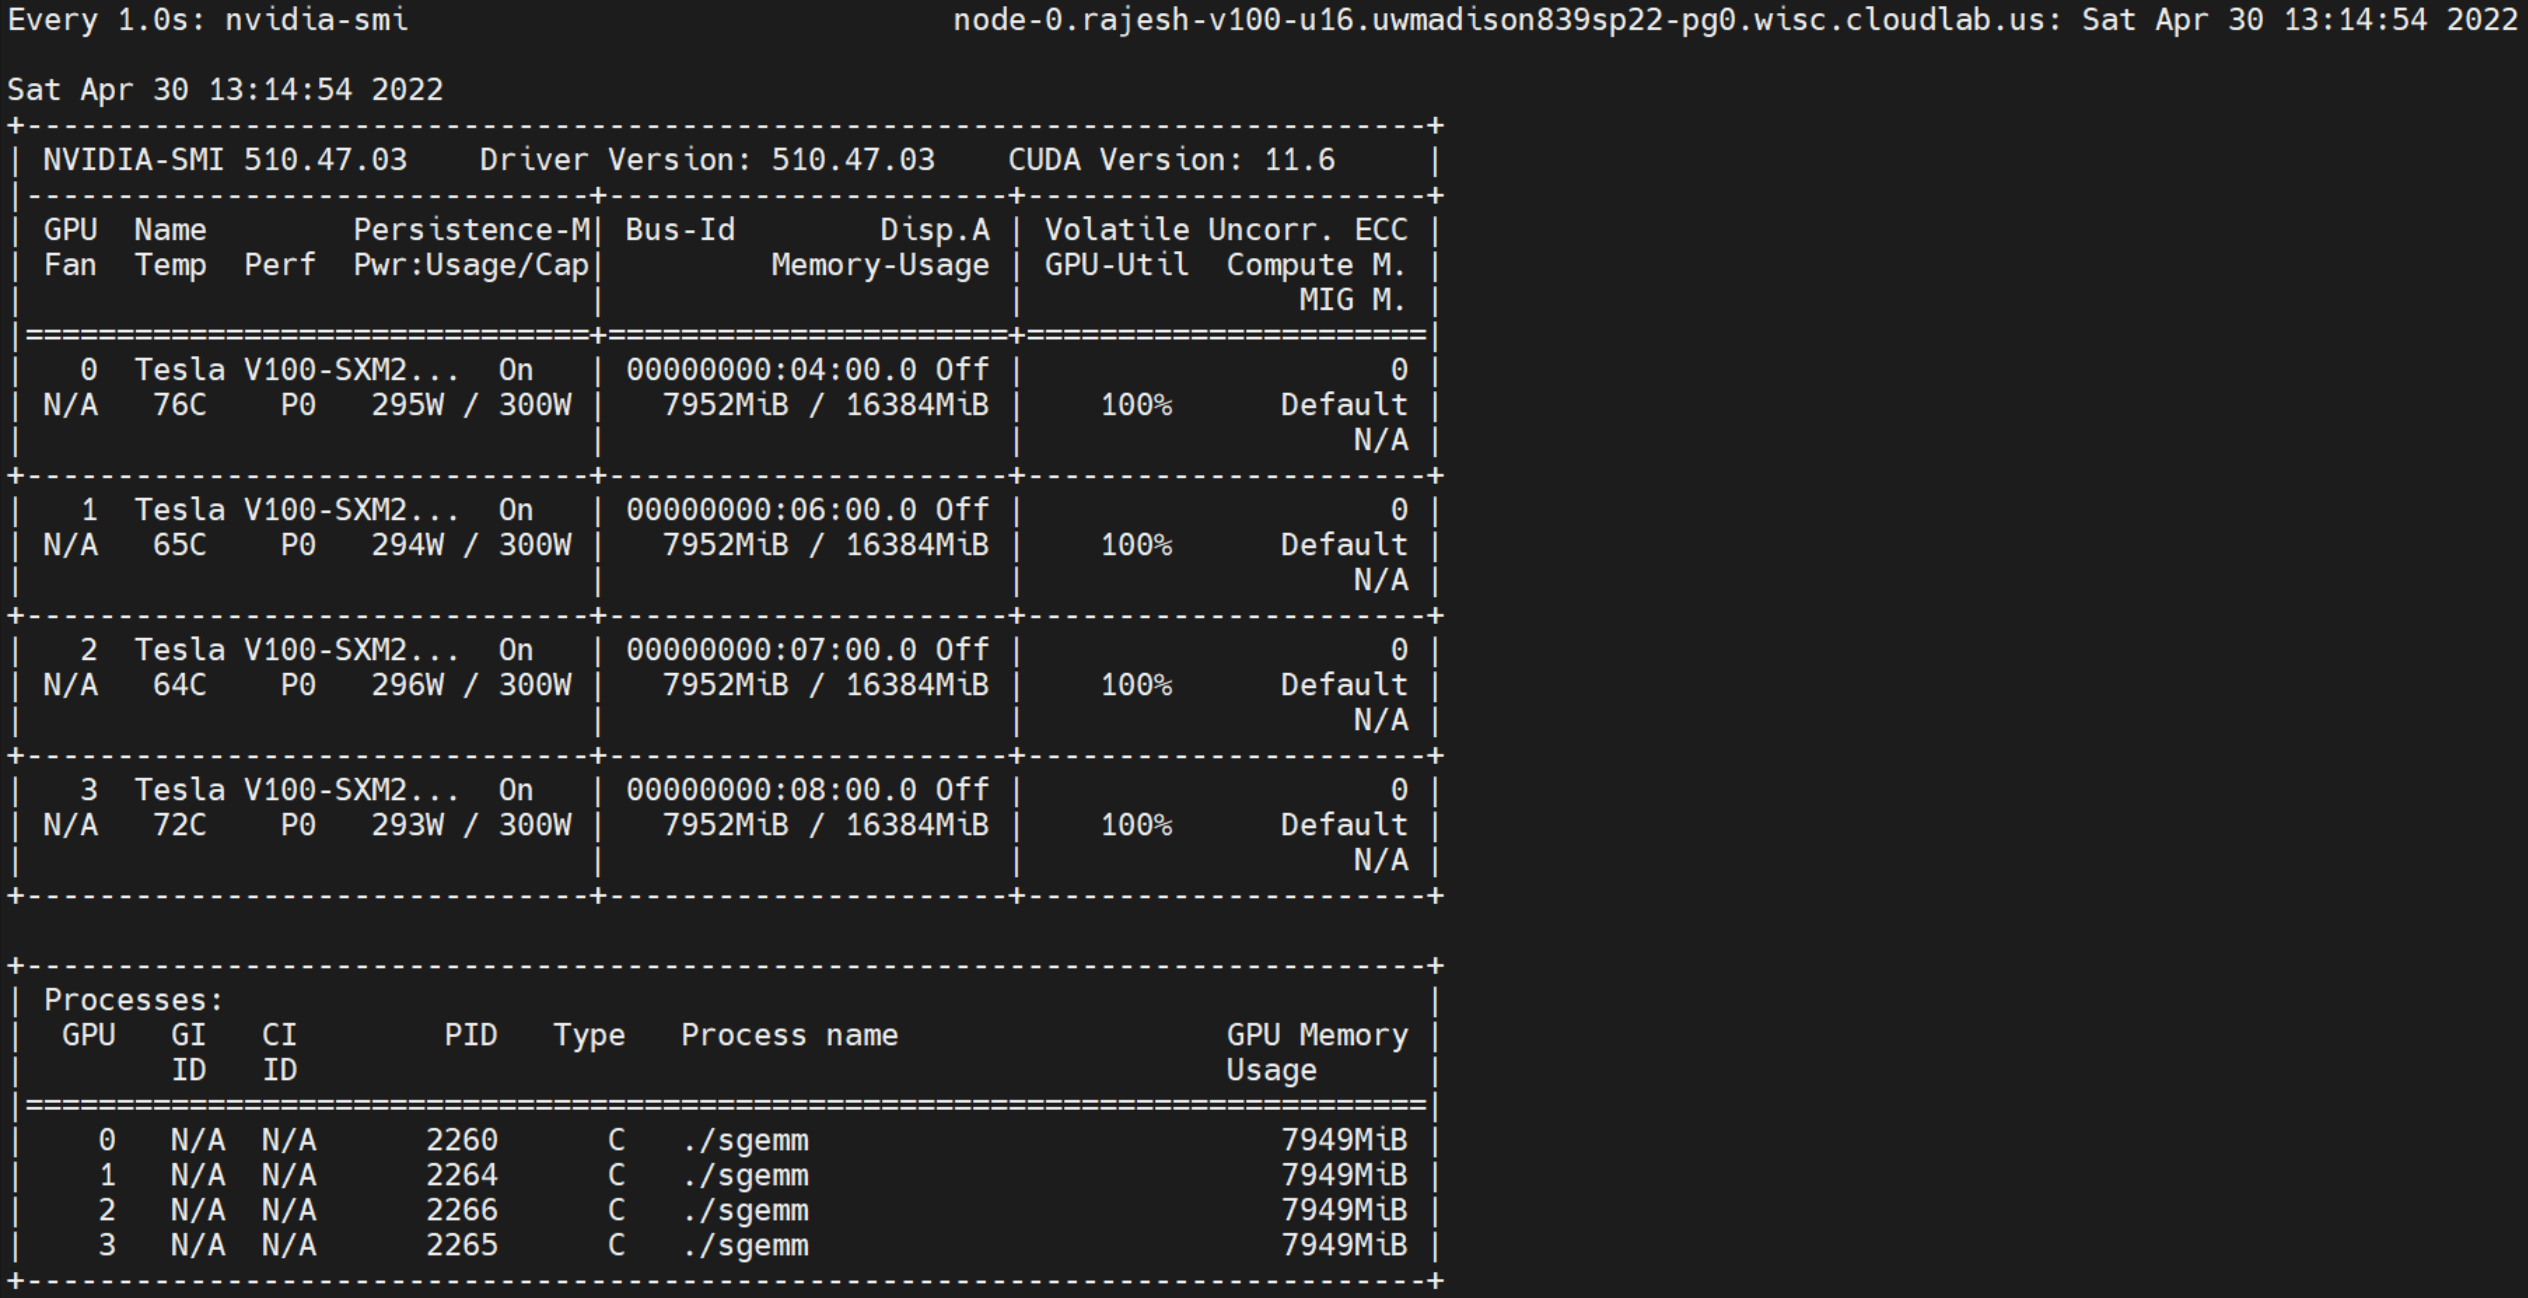
- Choosing 25536 results in maximum compute utilization on the V100. Use profiling to ensure that this is tuned for specific GPUs

3.2. Noise workloads
Reasoning behind choice: Vision Models (Compute intensive) and Language Models (Memory Intensive, DistributedDataParallel)

3.2.1. RESNET50
Implementation used: Nvidia DL Examples Resnet50v1.5
- TinyML dataset
wget https://image-net.org/data/tiny-imagenet-200.zip - Imagenet dataset
wget https://image-net.org/data/ILSVRC/2012/ILSVRC2012_img_train.tar. Extract, pre-process with commands on repo. Use tmux and docker withoutrmto process the data and then copy it to outside the container. The processed data can be used while launching the container for training - Launch docker with:
nvidia-docker run -it -v /store/DeepLearningExamples/PyTorch/Classification/imagenet:/imagenet --ipc=host nvidia_resnet50 - Run training
python ./main.py --arch resnet50 --data-backend pytorch --label-smoothing 0.1 /imagenet - Run training with nvprof
nvprof --print-gpu-trace --event-collection-mode continuous --system-profiling on --kernel-latency-timestamps on --csv --log-file resnet.csv --device-buffer-size 128 --continuous-sampling-interval 1 -f python ./main.py --arch resnet50 --data-backend pytorch --batch-size 128 --epochs 1 --label-smoothing 0.1 /imagenet - Modified version to allow selecting GPU core to run on in RESNET
nvprof --print-gpu-trace --event-collection-mode continuous --system-profiling on --kernel-latency-timestamps on --csv --log-file resnet.csv --device-buffer-size 128 --continuous-sampling-interval 1 -f python ./main.py --arch resnet50 --data-backend pytorch --batch-size 128 --epochs 2 --gpu_core 2 --label-smoothing 0.1 /imagenet
3.2.2. Transformers
- Launch docker with
nvidia-docker run -it --ipc=host -v /store/DeepLearningExamples/PyTorch/Translation/Transformer/data/data/wmt14_en_de_joined_dict:/data/wmt14_en_de_joined_dict your.repository:transformer bash - Run preprocessing
scripts/run_preprocessing.sh - Run training
scripts/run_training.sh
3.3. Run scripts
TBD
4. Handy Nvidia GPU commands
- Kill processes on GPUs
sudo fuser -k /dev/nvidia0/1/2/3 - nvidia-smi in continuous monitoring mode
$ watch -n 1 nvidia-smi - Querying stats from nvidia smi
nvidia-smi --format=csv --query-gpu=power.min_limit
5. Notes
- Achieve fairness and predictable performance in large cluster deployments for ML training, but not microsecond level predictability. Variations are natural in interactive systems.
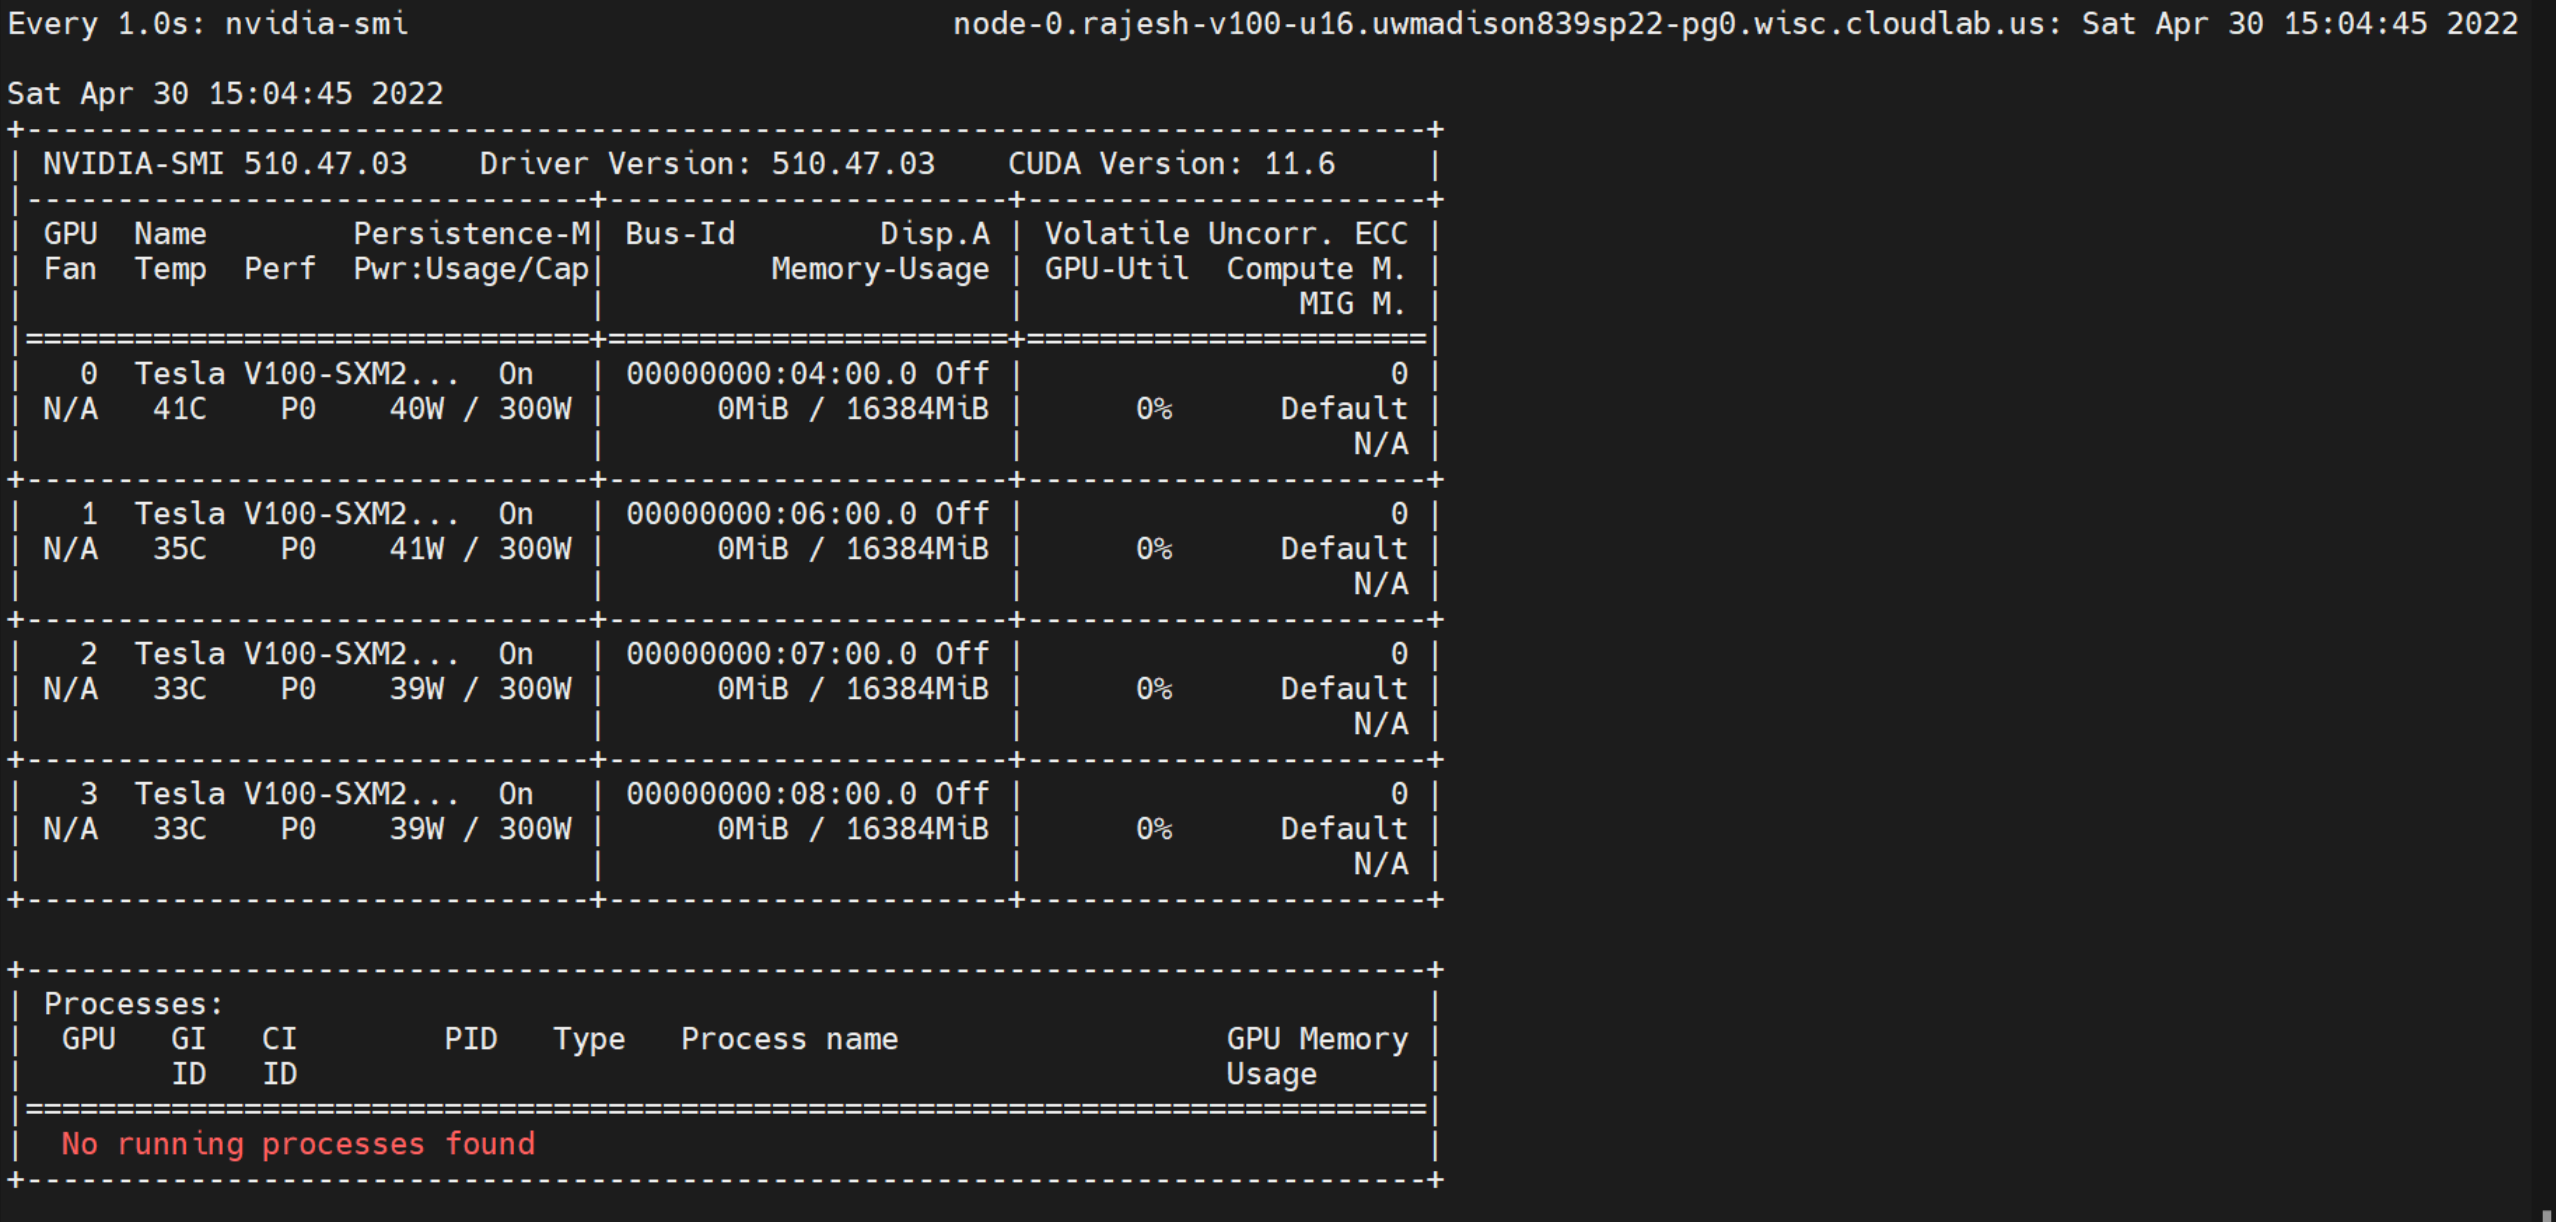
- If GPU0 is most frequently used and is susceptible to wear, can I save money on large scale training by just asking for the 4th GPU always? Wear levelling for GPUs. Idle power example:
- Everyone wants 100% utilization and 300W of power, Rowhammer for GPUs, make surrounding GPUs slower?
- Second order effects: Temperature, cooling, placement in cluster
- Selecting a GPU based on utilization in commandline https://stackoverflow.com/questions/39649102/how-do-i-select-which-gpu-to-run-a-job-on
- Gavel reference: 
- Continuous mode
- SMI query reference for persistence and other settings
- Any settings below for clocks and power get reset between program runs unless you enable persistence mode (PM) for the driver.