In order to get the data from the API, the requests module was used. Then, the data was stored in a SqlLite db using the sqlite3 package. In order to make a request a minute, the code used asyncio (package) to wait every 60 seconds. The code was run at the beginning of an hour and let run for 60 minutes. A seperate script was used for data analysis, with pandas and graphing.
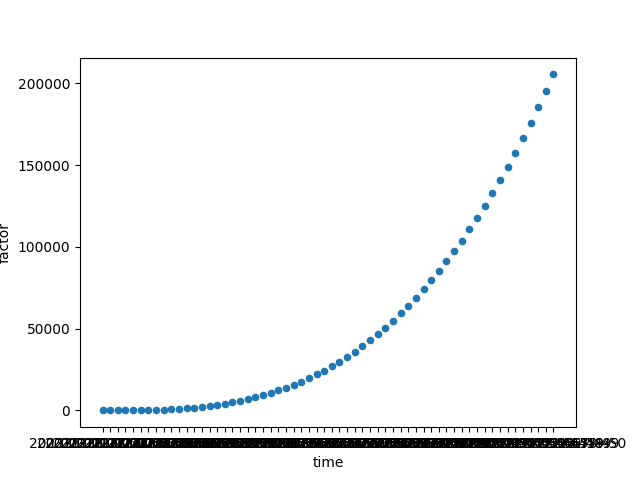
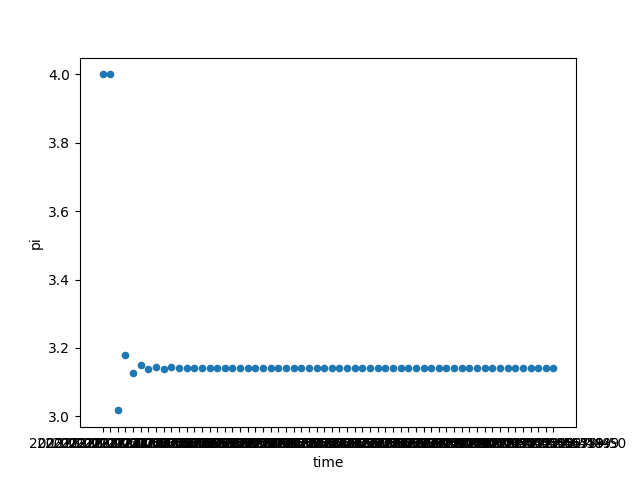
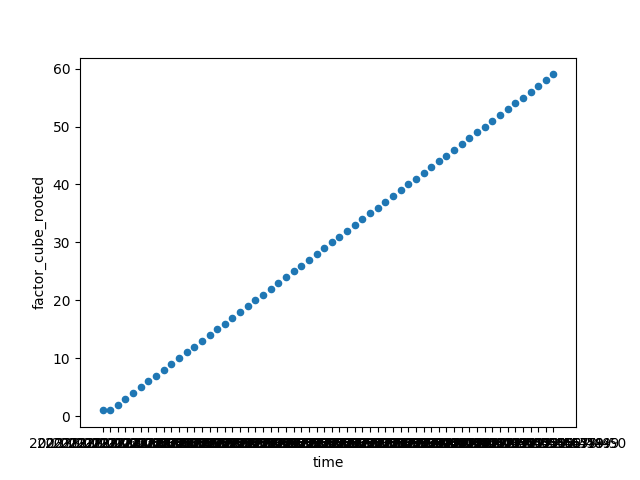
After looking at the data after it was collected, I graphed the data. The pi data seemed to be random, with the values fluctuating near the true value of pi: 3.1415... On the other hand, the values of factor seemed to follow a pattern, with the values seeming to increase in a pattern. In order to further explore, I decided to create time series graphs for both factor and pi. The graphs are attached below. In the beginning, the values seem to fluctuate until settling close to the true value of pi. The factor value seemed to be increasing uniformly. After checking the graph of the factors cube rooted, there seemed to be a positive linear correlation between the factors cube rooted and time. Therefore, I concluded that the factors column was just the cubes of time, with 1 corresponding with the 00 minutes time.