How to install grafana-kubernetes-app in IBM Cloud Private
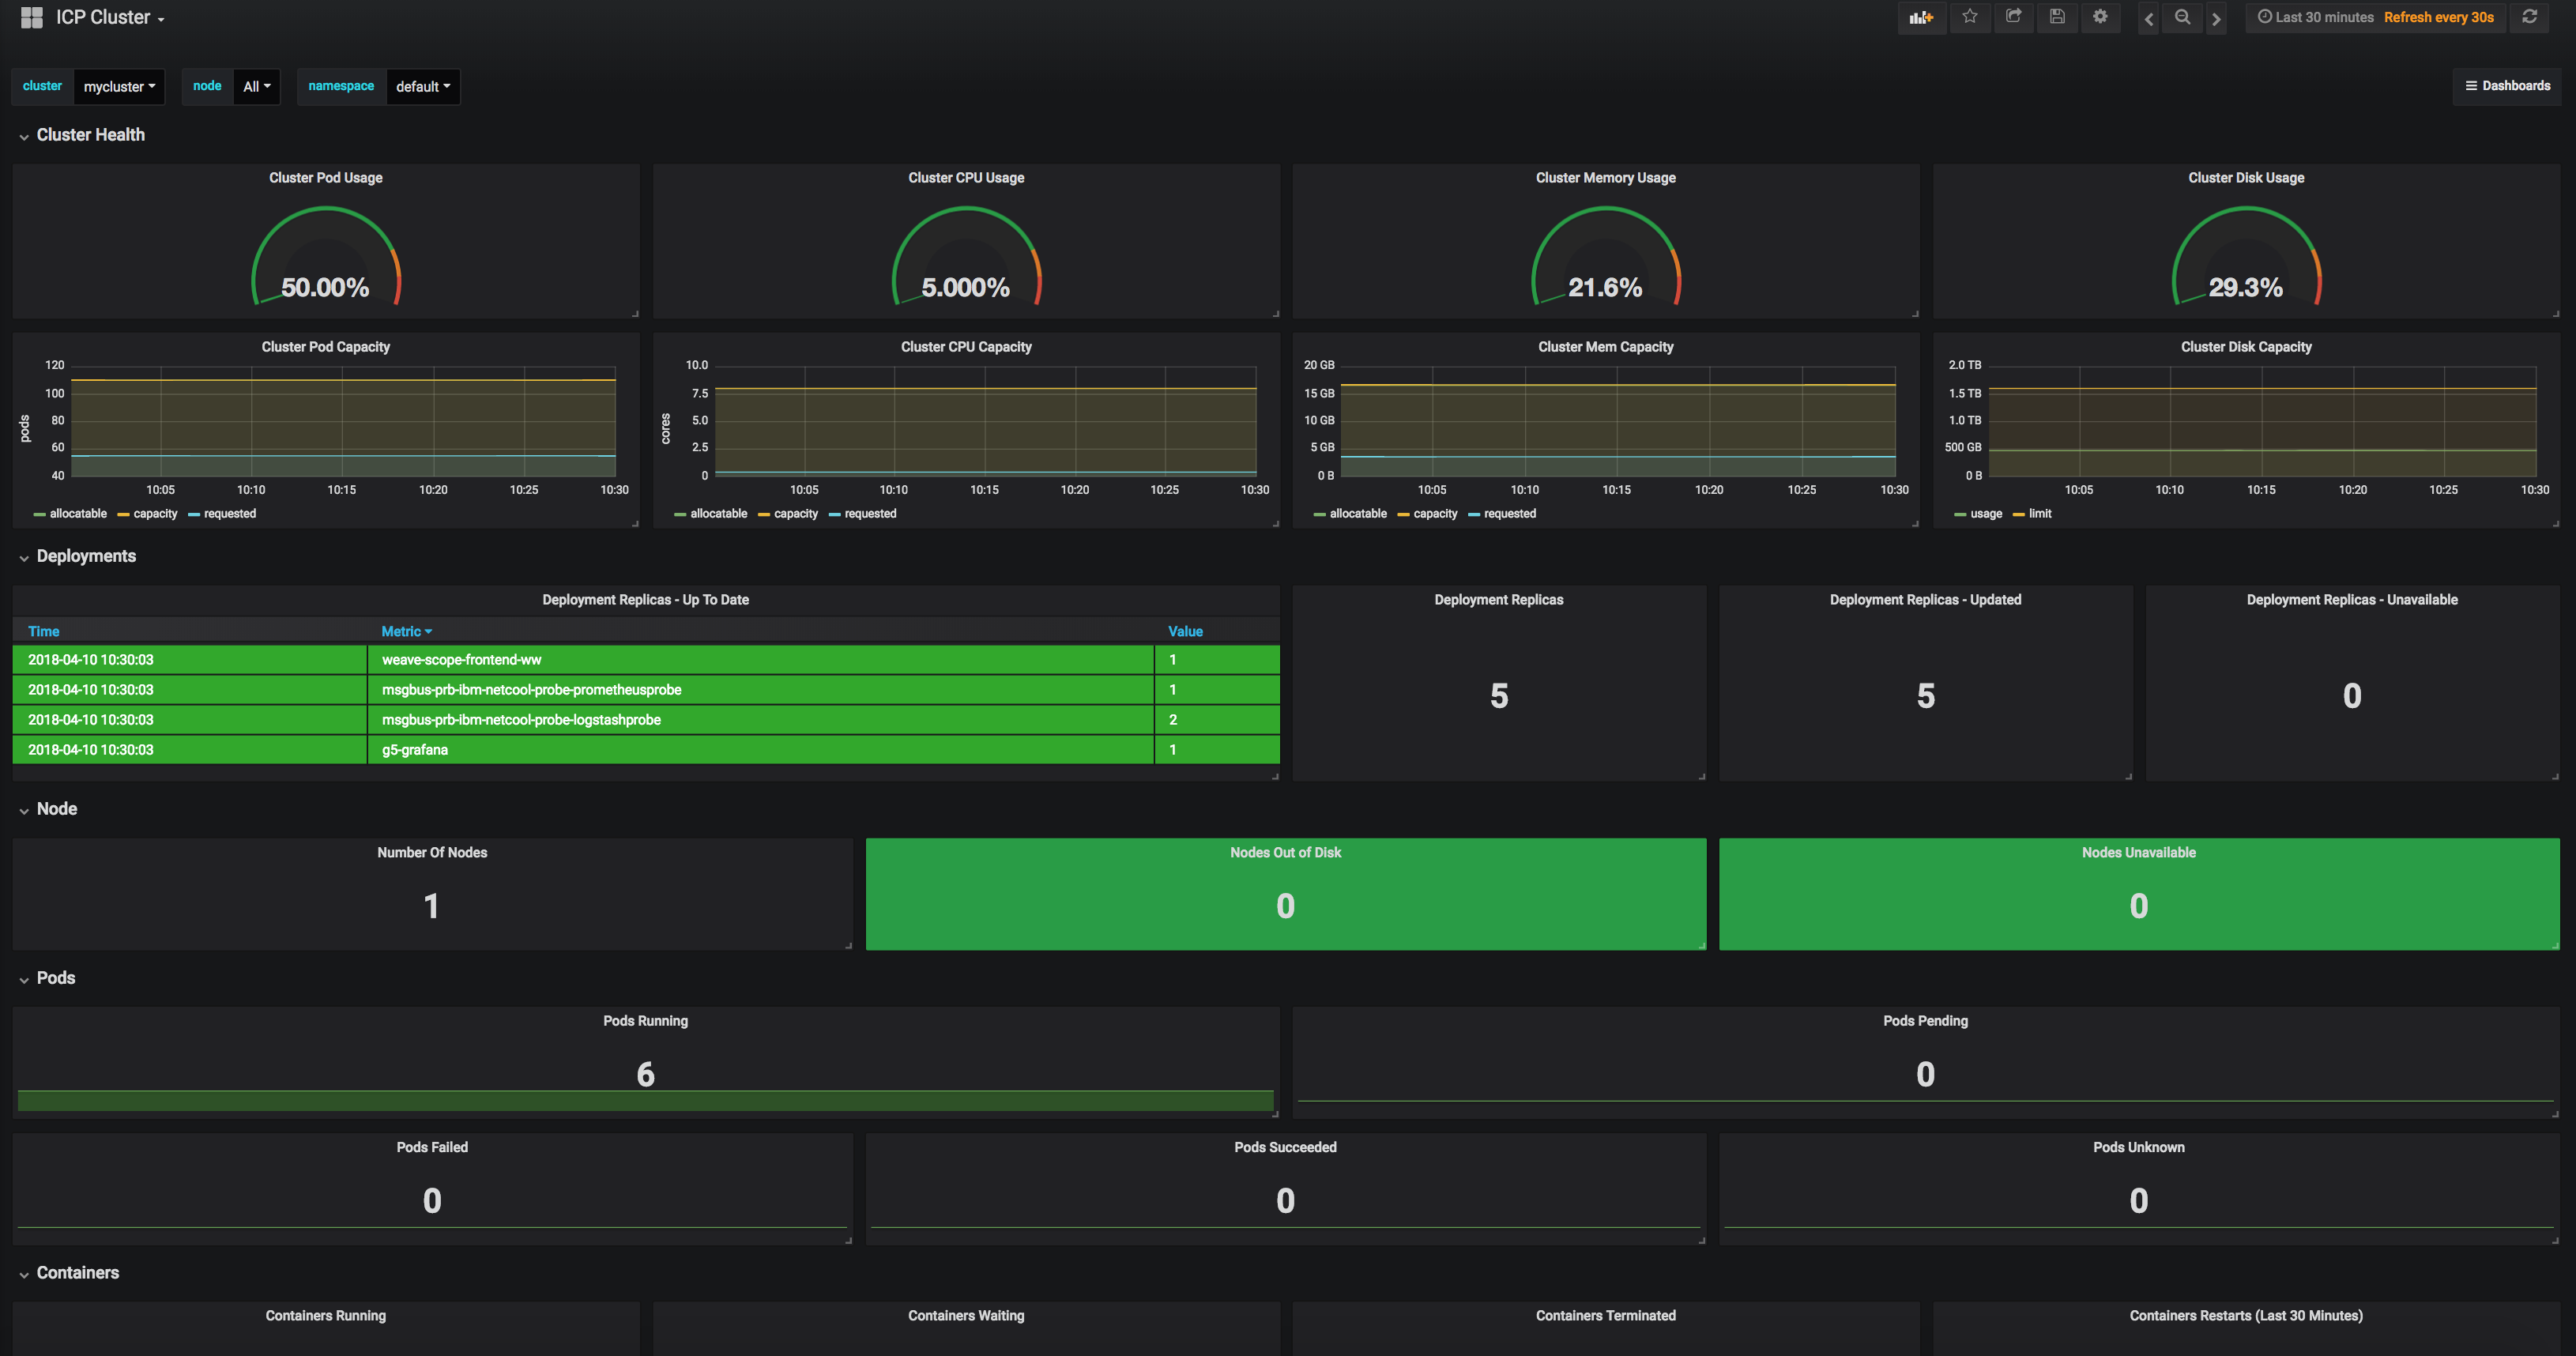
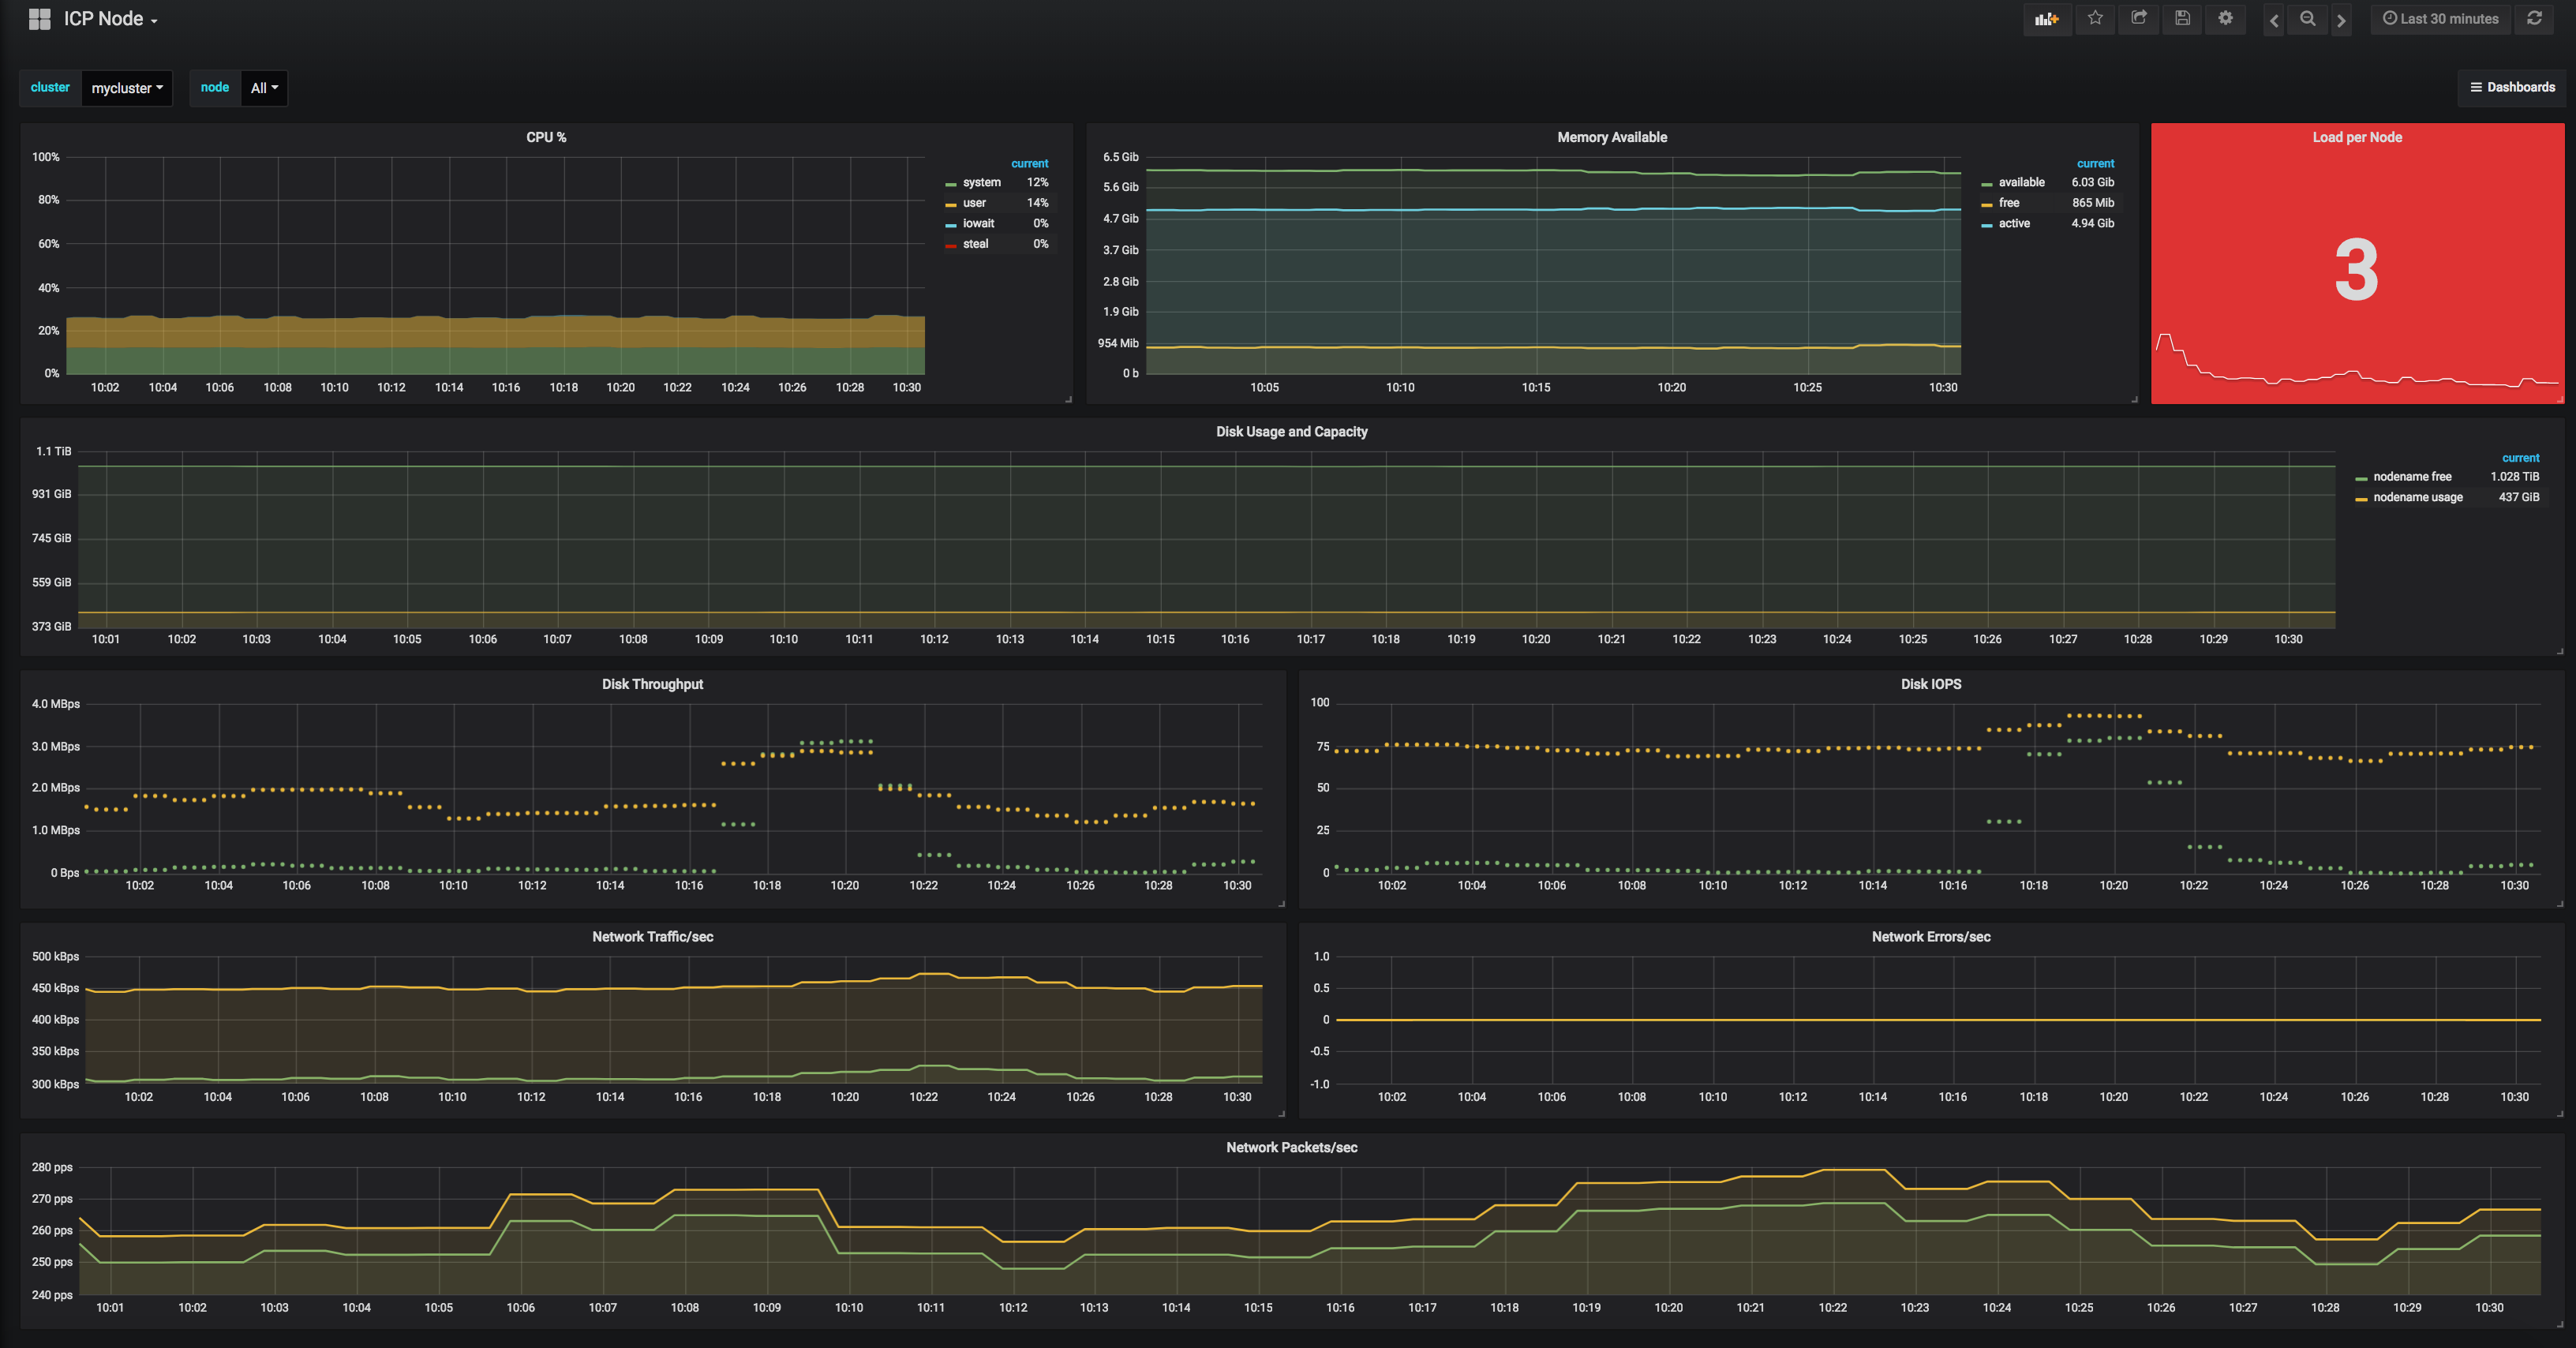
The Grafana Kubernetes Application allows you to monitor IBM Cloud Private Kubernetes cluster's performance. It includes dashboards for Cluster, Node and Pod/Container. The metrics collected are high-level cluster and node stats as well as lower level pod and container stats.
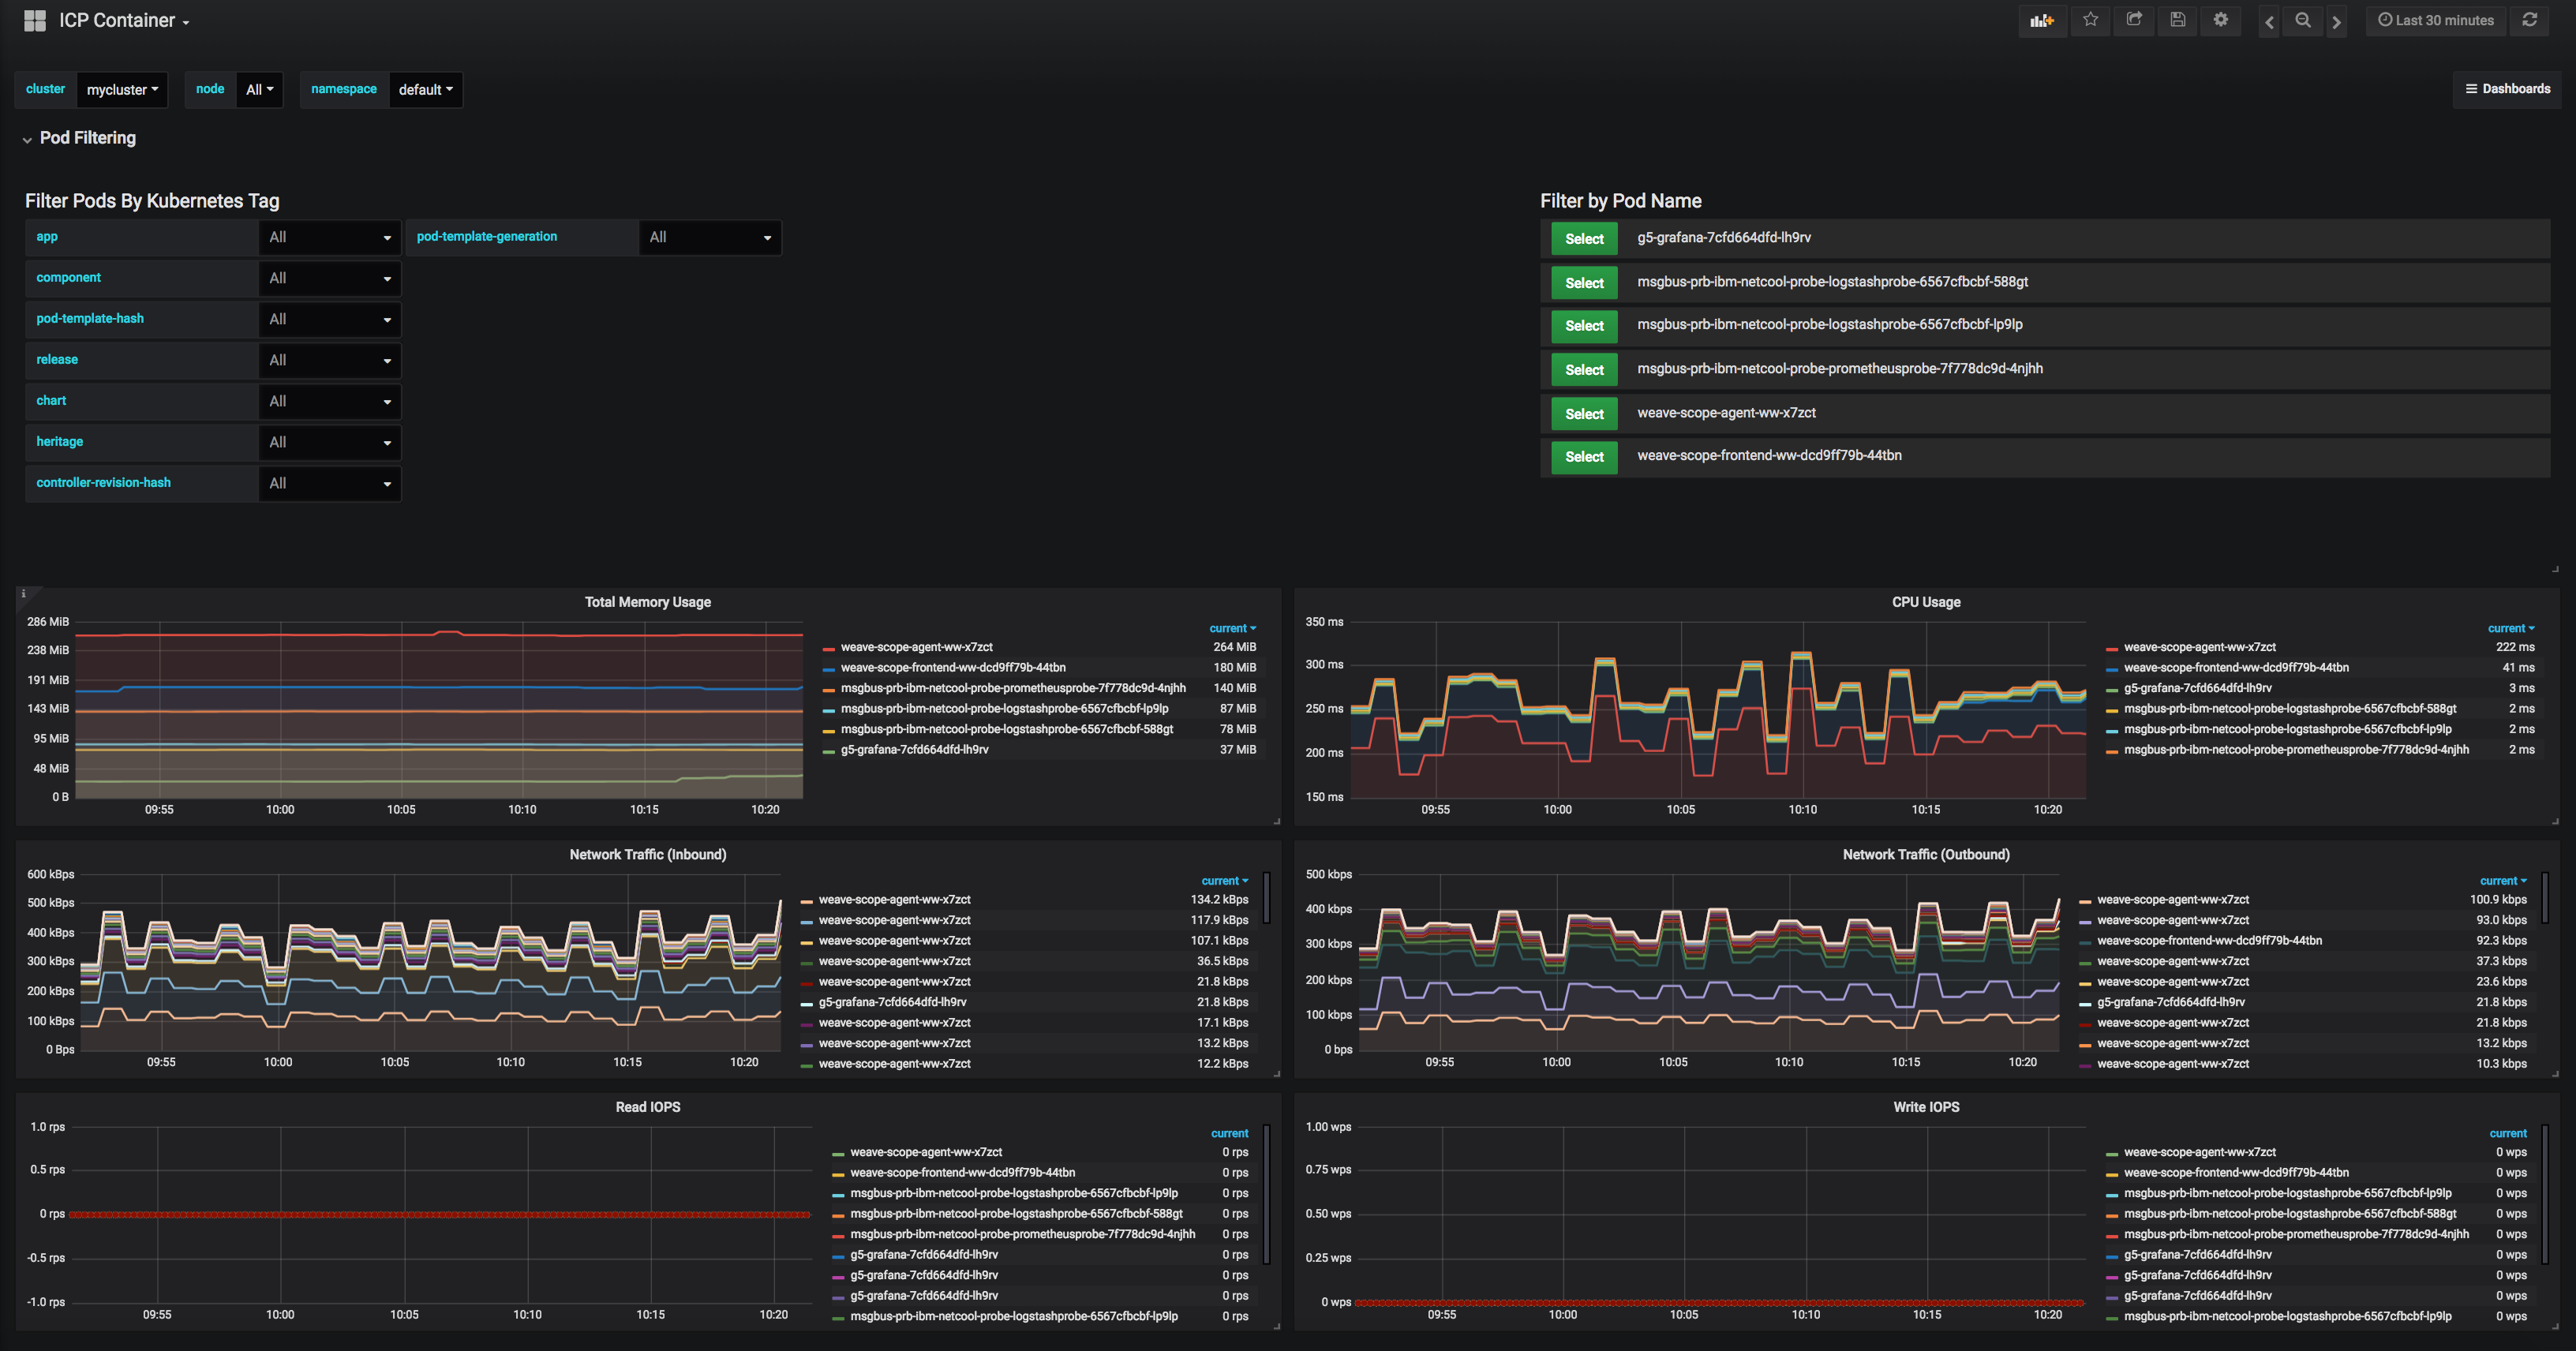
The app uses Kubernetes tags to allow you to filter pod metrics. Kubernetes clusters tend to have a lot of pods and a lot of pod metrics. The Pod/Container dashboard leverages the pod tags, so you can easily find the relevant pod or pods.
- Pod Capacity/Usage
- Memory Capacity/Usage
- CPU Capacity/Usage
- Disk Capacity/Usage
- Overview of Nodes, Pods and Containers
- CPU
- Memory Available
- Load per CPU
- Read IOPS
- Write IOPS
- %Util
- Network Traffic/second
- Network Packets/second
- Network Errors/second
- Memory Usage
- Network Traffic
- CPU Usage
- Read IOPS
- Write IOPS
- Configure PersistentVolume to store Grafana configuration.
- Deploy Grafana 5 in ICP using helm chart for Grafana, provided by the Kubernetes project.
- Modify the Grafana Pod with additional container which provide access to cluster API via
kubectl proxyclient. - Install the grafana-kubernetes-app inside the Grafana container.
- Configure connection to cluster API via sidecar container.
- Configure connection to standard ICP Prometheus instance.
- Make minor modifications to Prometheus queries in some of dashboard panels (some labels are specific to ICP).
1). Add https://kubernetes-charts.storage.googleapis.com to the list of helm repositories in ICP.
helm repo add kubernetes-charts https://kubernetes-charts.storage.googleapis.com
2). Verify that new repository is visible in helm CLI client:
$ helm repo update
Hang tight while we grab the latest from your chart repositories...
...Skip local chart repository
...Successfully got an update from the "stable" chart repository
Update Complete. ⎈ Happy Helming!⎈

$ helm repo list
NAME  	URL
kubernetes-charts	https://kubernetes-charts.storage.googleapis.com
local 	http://127.0.0.1:8879/charts
3). Configure PersistentVolume where Grafana configuration will be stored.
a. Create file pv-grafana.yaml
apiVersion: v1
kind: PersistentVolume
metadata:
  name: g5-grafana
spec:
  accessModes:
  - ReadWriteOnce
  capacity:
    storage: 1Gi
  hostPath:
    path: /tmp/grafana-data
    type: ""
  persistentVolumeReclaimPolicy: Recycle
b. create PersistentVolume g5-grafana using command:
kubectl create -f pv-grafana.yml
4). Install latest version of Grafana (5.0.4 at the time of writing this procedure).
helm install --name g5 kubernetes-charts/grafana --set server.service.type=NodePort --tls
5). Verify you can logon to new Grafana instance.
a.Identify port assigned by NodePort using:
$ kubectl get services
(...)
g5-grafana                    NodePort    10.0.0.209   <none>        80:3nnnn/TCP   5d
b. Collect initial admin password for your new Grafana 5 installation using:
kubectl get secret --namespace default g5-grafana -o jsonpath="{.data.grafana-admin-password}" | base64 --decode ; echo
c. Logon to Grafana http://<ICP_cluster_ip>:<port>
where <port> is a port ranging from 30000-32767 collected in step 5a.
6). Verify that PersistentVolume g5-grafana has status BOUND using:
kubectl get pv
7). Edit configuration of g5-grafana Deployment created during Grafana chart installation.
kubectl edit deployment g5-grafana
(add the following lines in the containers: section):
- name: kubectl
        image: k8s.gcr.io/kubectl:v0.18.0-120-gaeb4ac55ad12b1-dirty
        imagePullPolicy: Always
        args: [
          "proxy", "-p", "8001"
        ]
8). Login to the Grafana container and install grafana-kubernetesa-app from Grafana Labs`
a. Get the name of g5-grafana Pod.
kubectl get pod|grep g5-grafana
b. Logon to grafana container.
kubectl exec -it <your-g5-grafana-pod> -c grafana -- bash
c. Install grafana-kubernetes-app and exit container shell session.
$ grafana-cli plugins install grafana-kubernetes-app
$ exit
9). Delete g5-grafana Pod to reload Grafana configuration (it will be restored by g5-grafana Deployment).
kubectl delete pod <your-g5-grafana-pod>
10). Logon to Grafana and configure connection to default ICP Prometheus instance.
a. Set prometheus as data source name and URL as https://<prometeus_ClusterIP>:9090. Prometheus ClusterIP (service name: monitoring-prometheus) can be collected using:
kubectl get services -n kube-system|grep prometheus
b. Set Server as an access method.
c. Select checkboxes next to TLS Client Auth, With CA Cert and Skip TLS Verification (Insecure).
d. Copy output of the following command:
kubectl get secret monitoring-monitoring-ca-cert -o jsonpath='{.data.tls\.crt}' \
-n kube-system|base64 -D
into the field CA Cert.
e. Copy output of the following command:
kubectl get secret monitoring-monitoring-client-certs -o jsonpath='{.data.tls\.key}' \
-n kube-system|base64 -D
into the field Client Cert.
f. Copy output of the following command:
kubectl get secret monitoring-monitoring-client-certs -o jsonpath='{.data.tls\.crt}' \
-n kube-system|base64 -D
into the field Client Key.
g. Click Save & Test.
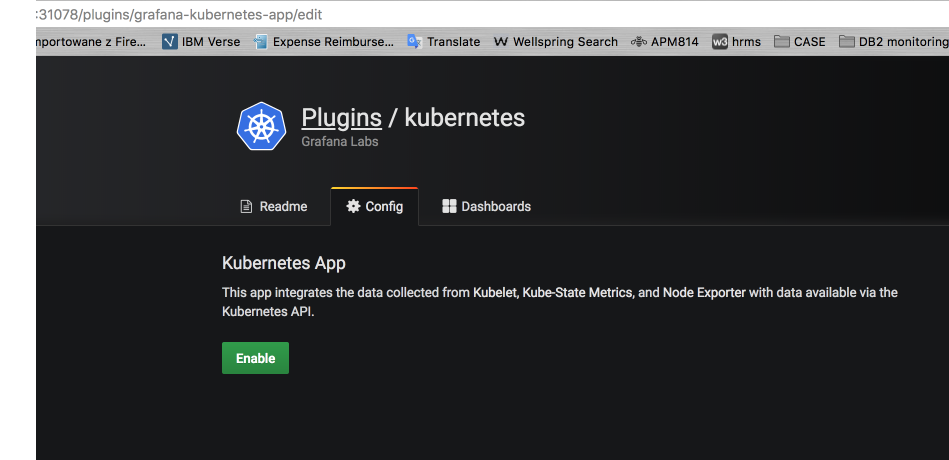
11). Verify that grafana-kubernetes-app plugin was installed. Access the URL: http://<ICP_cluster_ip>:<port>/plugins/grafana-kubernetes-app/edit where <port> is a port ranging from 30000-32767 collected in step 5a.
Click Enable button.

12). Configure connection to ICP cluster, use mycluster as a cluster name, http://localhost:8001 as a connection URL and server as an access method.
13). Replace default dashbards for Cluster, Node and Container with dashboards provided in this repository.


