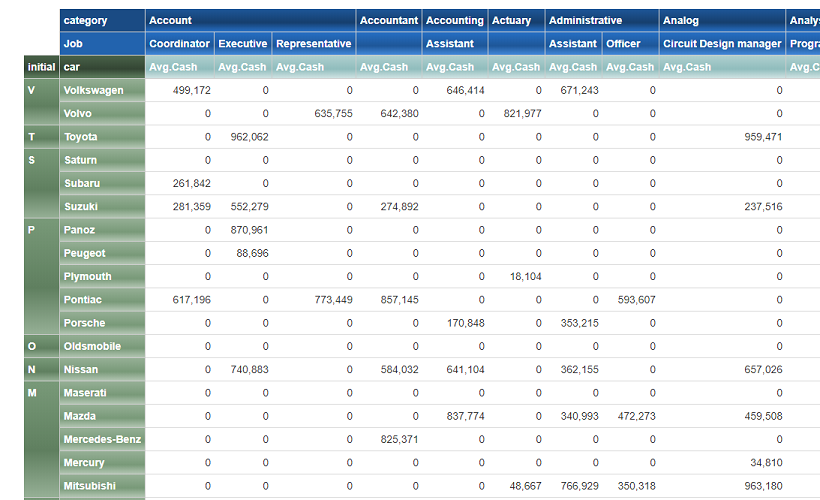
IEnumerable<T>をPivotTable風に変換するライブラリ。
↓
mvc5で使えるようヘルパを同梱してる。
public class MockData {
    public int id { get; set; }
    public string first_name { get; set; }
    public string last_name { get; set; }
    public string company { get; set; }
    public string gender { get; set; }
    public string car { get; set; }
    public string country { get; set; }
    public string Job { get; set; }
    public string stock_market { get; set; }
    public decimal stock { get; set; }
    public decimal cash { get; set; }
}
というモデルに対して
    var pivot = SampleDB.Data.ToPivotTable(
        PivotColumn<MockData>.Build("country", "gender"), // 行に展開される軸
        PivotColumn<MockData>.Build("stock_market"), // 列に展開される軸
        PivotMeasure<MockData>.Build("stock") // 集計する値
    );
と ToPivotTable() とするだけでピボットが作成できる。
MVC5を使用している場合はビューのcshtml内で
@Html.RenderPivotTable(Model.pivot, Model.Option)と、するだけでいい感じに描画してくれる。
複数項目で集計する場合は
PivotMeasure<MockData>.Build("stock","cash") と列挙する。
model.pivot = SampleDB.Data.ToPivotTable(
        PivotColumn<MockData>.Build("country", "gender"),
        PivotColumn<MockData>.Build("stock_market"),
        new List<PivotMeasure<MockData>>() {
            PivotMeasure<MockData>.Count("Count",(t)=>t.stock),
            PivotMeasure<MockData>.Sum("Sum",(t)=>t.stock),
            PivotMeasure<MockData>.Average("Avg",(t)=>t.stock),
            PivotMeasure<MockData>.Min("Min",(t)=>t.stock),
            PivotMeasure<MockData>.Max("Max",(t)=>t.stock),
        }
);model.pivot = SampleDB.Data.ToPivotTable(
PivotColumn<MockData>.Build("country", "gender"),
PivotColumn<MockData>.Build("stock_market"),
new List<PivotMeasure<MockData>>() {
PivotMeasure<MockData>.Count("Count",(t)=>t.stock),
PivotMeasure<MockData>.Sum("Sum",(t)=>t.stock),
PivotMeasure<MockData>.Average("Avg",(t)=>t.stock),
PivotMeasure<MockData>.Min("Min",(t)=>t.stock),
new ComplexPivotMeasure<MockData>(
"AvgPrice",
(values)=> (values.Length==2 && values[0]!=0)?(values[1] / values[0]):0,
PivotMeasure<MockData>.Sum("Sum",(t)=>t.stock),
PivotMeasure<MockData>.Sum("Sum",(t)=>t.cost)
),
}
);ComplexPivotMeasure を使用するとMeasureの値を元に再計算を行える。
model.pivot = DB.ToPivotTable(
        new List<PivotColumn<MockData>>() {
            new PivotColumn<MockData>("initial",(t)=>t.car.Substring(0,1),(t)=>t.car.Substring(0,1)){
                Order=PivotOrder.Descending,
            },
            new PivotColumn<MockData>("car"),
        },
        new List<PivotColumn<MockData>>() {
            new PivotColumn<MockData>("category",(t)=>t.Job.Split(' ').First(),(t)=>t.Job.Split(' ').First()),
            new PivotColumn<MockData>("Job",(t)=>string.Join(" ",t.Job.Split(' ').Skip(1))),
        },
        new List<PivotMeasure<MockData>>() {
            PivotMeasure<MockData>.Average("Avg.Cash",(t)=>t.cash),
        }
    );
とする。
public PivotColumn(string PropertyName, Func<T, string> titleGetter = null, Func<T, dynamic> valueGetter = null) | パラメータ | 設定値 |
|---|---|
| PropertyName | プロパティ名、valueGetterが設定されていない場合はT.PropertyNameを値として参照する。 |
| titleGetter | 列や行のタイトルとして表示される値を取得する。未設定の場合は値のToString()が使用される。 |
| valueGetter | 列や行の集計対象の値を取得する。 |
var pivot = SampleDB.Data.ToPivotTable(
        PivotColumn<MockData>.Build("country", "gender"), // 行に展開される軸
        PivotColumn<MockData>.Build("stock_market"), // 列に展開される軸
        PivotMeasure<MockData>.Build("stock") // 集計する値
).flip();flip()を使う
    model.Option.Header[HeaderType.Row].RenderTotal = true;
model.Option.HeaderCellOption[model.pivot.ColumnByName("country")].RenderTotal = true;PivotTableRenderOption.HeaderやPivotTableRenderOption.HeaderCellOptionのRenderTotalをtrueに設定する。
table.pivot {
    display: table;
    border-collapse: separate;
    border-spacing: 0px;
    @ColHeaderBaseColor: #1E5799;
    @RowHeaderBaseColor: #608060;
    @BorderColor: #ddd;
    @measureTitleColor: #b0d0d0;

    .number {
        text-align: right;
    }

    .rowtitle {
        .gradientCell(darken(@RowHeaderBaseColor,10%));
    }

    th, td {
        padding: 5px;
        white-space: nowrap;
    }

    .cornerHeader {
        background-color: white;
    }

    .gradientCell(@CellBaseColor) {
        color: white;
        background: @CellBaseColor;
        background: -moz-linear-gradient(top, @CellBaseColor 0%, darken(@CellBaseColor,10%) 60%, lighten(@CellBaseColor,10%) 100%); /* FF3.6-15 */
        background: -webkit-linear-gradient(top, @CellBaseColor 0%, darken(@CellBaseColor,10%) 60%, lighten(@CellBaseColor,10%) 100%); /* Chrome10-25,Safari5.1-6 */
        background: linear-gradient(to bottom, @CellBaseColor 0%, darken(@CellBaseColor,10%) 60%, lighten(@CellBaseColor,10%) 100%); /* W3C, IE10+, FF16+, Chrome26+, Opera12+, Safari7+ */
    }

    .headerRowMixin(@ColHeaderBGColor: @ColHeaderBaseColor) {
        th {
            color: white;
            border-right: #ccc 1px solid;
            border-bottom: #ccc 1px solid;
        }

        .coltitle {
            background-color: darken(@ColHeaderBGColor,5%);
        }

        .cell {
            .gradientCell(@ColHeaderBGColor);
        }

        .colGrandTotal {
            .gradientCell(darken(@ColHeaderBGColor,10%));
        }
    }

    tr.headerRow:nth-child(1) {
        .headerRowMixin(@ColHeaderBaseColor)
    }

    tr.headerRow:nth-child(2) {
        .headerRowMixin(lighten(@ColHeaderBaseColor,10%));
    }

    tr.headerRow:nth-child(3) {
        .headerRowMixin(lighten(@ColHeaderBaseColor,20%));
    }

    tr.headerRow:nth-child(4) {
        .headerRowMixin(lighten(@ColHeaderBaseColor,30%));
    }

    .measureTitle {
        .gradientCell(@measureTitleColor);
        white-space: nowrap;
    }

    tr.dataRow {
        td, th {
            border-bottom: @BorderColor 1px solid;
        }

        &:hover {
            background-color: #eee;
        }

        th.cell {
            vertical-align: top;
            border-right: #ccc 1px solid;
            border-bottom: #ccc 1px solid;

            &.ch-0 {
                .gradientCell(lighten(@RowHeaderBaseColor,10%));
            }

            &.ch-1 {
                .gradientCell(lighten(@RowHeaderBaseColor,20%));
            }

            &.ch-2 {
                .gradientCell(lighten(@RowHeaderBaseColor,30%));
            }

            &.GrandTotal {
                .gradientCell(darken(@RowHeaderBaseColor,10%));
            }
        }
    }
}div.pivot-host {
height: 800px;
width: 100%;
overflow: auto;
}$(function () {
let table = $("table.pivot");
let fixedRow = table.data("hrows");
let fixedCol = table.data("hcols");
let top = 0;
for (let i = 0; i < fixedRow; i++) {
let cell = $("table.pivot>thead>tr.headerRow>.cell.rh-" + i);
if (cell.length === 0) break;
$("table.pivot>thead>tr.headerRow>.rh-" + i).css({
"position": "sticky",
"top": top,
"z-index": 1
});
top += cell.outerHeight();
}
$("table.pivot>thead>tr.headerRow>.measureTitle").css({
"position": "sticky",
"top": top,
"z-index": 1
});
$("table.pivot>thead>tr.headerRow>.rowtitle").css({
"position": "sticky",
"top": top,
"z-index": 1
});
let left = 0;
for (let i = 0; i < fixedCol; i++) {
let cell = $("table.pivot tr.dataRow .ch-" + i);
if (cell.length === 0) break;
$("table.pivot .ch-" + i).css({
"position": "sticky",
"left": left,
"z-index": 2
});
left += cell.outerWidth();
}
$("table.pivot tr.dataRow .measureTitle").css({
"position": "sticky",
"left": left,
"z-index": 2
});
$(".cornerHeader").css("z-index", 3);
$(".coltitle ,.rowtitle").css("z-index", 3);
});現状IEnumerable<T>を集計するために直接クエリを発行している。 これだと集計をかけるために一度全部メモリに載せなければいけないのは流石にリッチすぎるので、先にPivotColumn/PivotMeasureの定義に従いLinqToEntityなんかで集計してから、整形のためにToPivotを使うような流れにしたい。
// parameter : IEnumerable<T> source

var listed = source
    .GroupBy(t=>new {/*PivotColumnの定義からキーを作る*/})
    .Select(grp=> new {
        leadObject = grp.First(),
        Count_stock = grp.Count(), // Measureの集計をしておく
        Sum_stock = grp.Sum(t=>t.stock),
    })
    .ToList()
    .Select(obj=>{
        var res = (T)obj.MemberwiseClone();
        res./* Measure用の集計値を保存 */
    });
的な。
その場合Measureの値を保存するためにTに新しいプロパティを追加する必要があるのでそのへんをどうするか。 Tを継承したクラスを作り出して使うとか?

