promplot is an opinionated tool to create plots from your Prometheus metrics and automatically sends them to you.
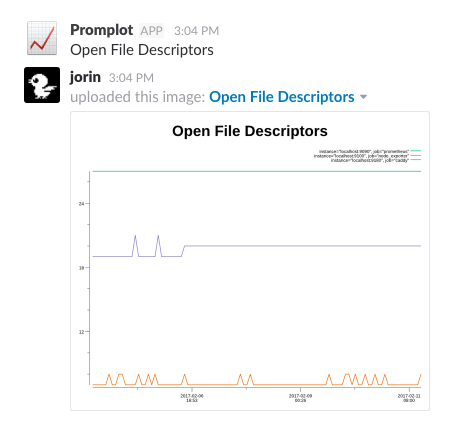
Slack example:
promplot -title "Open File Descriptors" -query "process_open_fds" -range "7d" -url $promurl -slack $slacktoken -channel statsCurrently the only implemented transport is Slack. But feel free to add a new one!
Usage: promplot [flags...]

Create and deliver plots from your Prometheus metrics.

Save plot to file or send it right to a slack channel.
One of -slack or -file must be set.


Flags:
  -channel string
        Required when -slack is set. Slack channel to post to.
  -file string
        File to save image to. Should have same extension as specified -format. Set -file to - to write to stdout.
  -format string
        Optional. Image format. For possible values see: https://godoc.org/github.com/gonum/plot/vg/draw#NewFormattedCanvas (default "png")
  -query string
        Required. PQL query.
  -range value
        Required. Time to look back to. Format: 5d12h34m56s
  -silent
        Optional. Suppress all output.
  -slack string
        Slack API token (https://api.slack.com/docs/oauth-test-tokens). Set to post plot to Slack.
  -time value
        Time for query (default is now). Format like the default format of the Unix date command.
  -title string
        Optional. Title of graph. (default "Prometheus metrics")
  -url string
        Required. URL of Prometheus server.
  -version
        Print binary version.
- With Go:
go get qvl.io/promplot
- With Homebrew:
brew install qvl/tap/promplot
- Download from https://github.com/qvl/promplot/releases
It's simple to create a shell script for multiple plots:
common="-url $promurl -channel stats -slack $slacktoken -range 24h"

promplot $common \
  -title "Free memory in MB" \
  -query "node_memory_MemFree /1024 /1024"

promplot $common \
  -title "Free disk space in GB" \
  -query "node_filesystem_free /1024 /1024 /1024"

promplot $common \
  -title "Open file descriptors" \
-query "process_open_fds"There is no mail transport built into promplot but you can use the Linux mail utility instead:
tmp="$(mktemp -d)"
common="-url $promurl -range 24h"

promplot $common \
  -title "Free memory in MB" \
  -query "node_memory_MemFree /1024 /1024" \
  -file ${tmp}/memory.png

promplot $common \
  -title "Open file descriptors" \
  -query "process_open_fds" \
  -file ${tmp}/fds.png

echo "Your daily report is here." | mail \
  -s "Daily server stats" \
  -a ${tmp}/memory.png \
  -a ${tmp}/fds.png \
  name@example.com
And with a scheduler like sleepto you can easily automate this script to run every day or once a week.
Make sure to use gofmt and create a Pull Request.
When changing external dependencies please use dep to vendor them.
Push a new Git tag and GoReleaser will automatically create a release.
to these helpful open source projects promplot is built on top of:
