Provides ability to execute arbitrary queries on Q servers and see their results.
connect-kdb-q requires:
language-kdb-qpackage for grammar.
This package provides the following services:
- It fully supports Q protocol and is able to connect to 3.x servers (2.x is accounted for but not tested).
- All Q objects are exactly represented by JS objects including long type which is not supported natively in JS. Uncompression is supported. Visual representation of Q types is identical to Q console.
- You can fast select servers and connect to them in Select Server view using tags and filters. Two configuration files are supported for project wide servers and user servers. It is also possible to enter servers manually. It is possible to connect to different servers in different panels.
- Server connection status is displayed in the status bar and in Select Server view.
- You can execute selected text or the current line. Results are shown in a separate Query Results view which is an ordinary editor with some additional features, thus you can use it as Q Console to execute ad-hoc queries, copy data, use autocomplete to navigate code and etc.
- Query Results view provides information about the query, its result type and size. If the result is too big to fit it is possible to request to print additional data.
You can provide two config files with server details:
qservers.json- project wide servers (probably autogenerated using .j.j).qservers_user.json- your own servers. You can create/edit this file in Atom.
These files should reside in $HOME/.atom/ directory. C:\Users\user\.atom on Windows. Their paths are printed into Atom console if they are not found.
Config file format is:
{
  "region" : "EMEA US ASIA JPN",
  "tagname" : ["v1","v2","v3"],
  "tagname:list": ["l1","l2","l3"],
  "uname": "defaultUname",
  "pass": "defaultPass",
  "servers" : [
    {
      "host" : "myserver.com",
      "port" : 5566,
      "tags" : "EMEA PROD stock",
      "name" : "Main HDB",
      "uname": "myname",
      "pass" : "mypass"
    },{
      "port" : 5566,
      "tags": "US UAT"
    },{
      "port" : 5566,
      "uname" : "myname",
      "tags": "EMEA UAT"
    }
  ]
}
The first server entry has all available settings:
- host - localhost by default.
- port - port.
- uname - user name, empty by default.
- pass - password, empty by default.
- name - optional pretty name for the server. If it is not provided it gets constructed from other fields.
- tags - optional tags to speed up search for this server, should be a string or array of strings. EMEA, stock, mysrv and etc.
You can provide the default username and password. They will be used for all connections that do not have a username set.
You can also provide optional tags in the top level object that will be shown as filters in the server view. Tags are displayed as buttons or lists, lists should be marked with ':list'.
Hosts and ports are automatically converted to tags.
Note that tags field in 'servers' can contain any tags not only declared ones.
To open the server view:
- Select
KDB-Q/Connect to a servermenu item. - Click the server name in the status bar (if you've already activated the package once).
- Try to execute any query in a Q file. Server view will be shown if there is no current server or it is not possible to connect to it.
You'll see something like this:
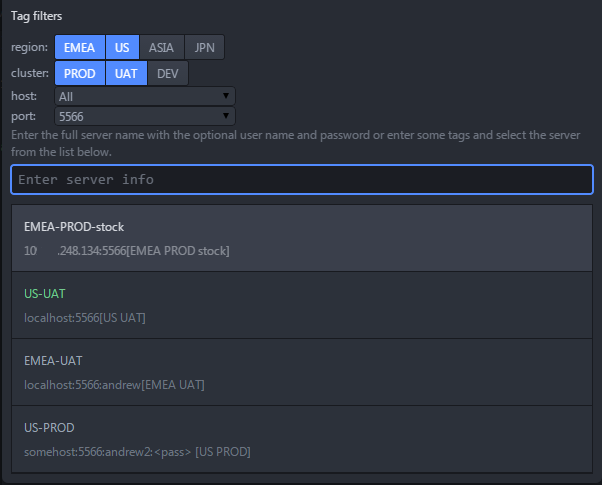
You can click on tag's buttons to filter the server's list. You can also select a specific port or host. Or you can enter any tags separated by spaces in the text input field. Anyway the server list will be filtered to include only tagged servers. You can select a server by pressing Enter or double click. You can click on the list or use Up or Down buttons to navigate it.
Finally you can enter the server directly into the text field. The format is [host]:port[:username[:password]]. Press Enter.
To close the view press Esc
Note that the servers with open connections are shown in green. You can't open a new connection to the already connected server but you can create additional connections by using hostname aliases or different user names.
The server status is shown in the status bar. Good servers are shown in green and bad in red. If there was a connection error you can point your mouse to the server name to see additional information. You can also click on the server name to change the server.
Once you selected a server it will be attached to the current file and/or become the default server. You can select different servers in different files, they will be switched automatically as you switch between the files.
Atm it is not possible to close connections. Reload the editor if you need this.
Once you connected to some server you can start to execute queries. You can either execute the current line by pressing Ctrl-Enter or select some text and press Ctrl-E. Also you can select execute-selection command in either context or global KDB-Q menus.
The query result will be printed into Query Result view. It will be created in the bottom, top, left or on the right of the current pane/dock. It is actually an ordinary editor with some additional features thus you can use it as you could have used any Q editor view - execute queries, connect to servers, use other packages related to Q and etc.
There some settings associated with this view:
- DockPosition - where to put the view. Select none to use ordinary panes.
- QueryResultsPosition - right, left, top or bottom. Where the view will be created.
- ResultFontSize - in order to see as much data as possible you can set a smaller font than in other editor views.
- maxResults - if you close the query view all text will be lost but when you reopen it maxResults last queries will be added to the view.
- maxFullResults - raw query data gets deleted to free memory for all maxResults except the last maxFullResults.
- showWidth and showHeight - similar to \c command in Q console.
- resultFmt - customize how the results are printed into Query Results window. It is 'INFO RES QUERY' by default and these tags can be rearraged or dropped.
Text in the query view is divided into two parts by '=== cut line ===' line. New query results get printed after this line. The space above can be used for ad-hoc queries. Thus the query view can be used as a Q console inside the editor.
If you execute some query you'll see something like this:
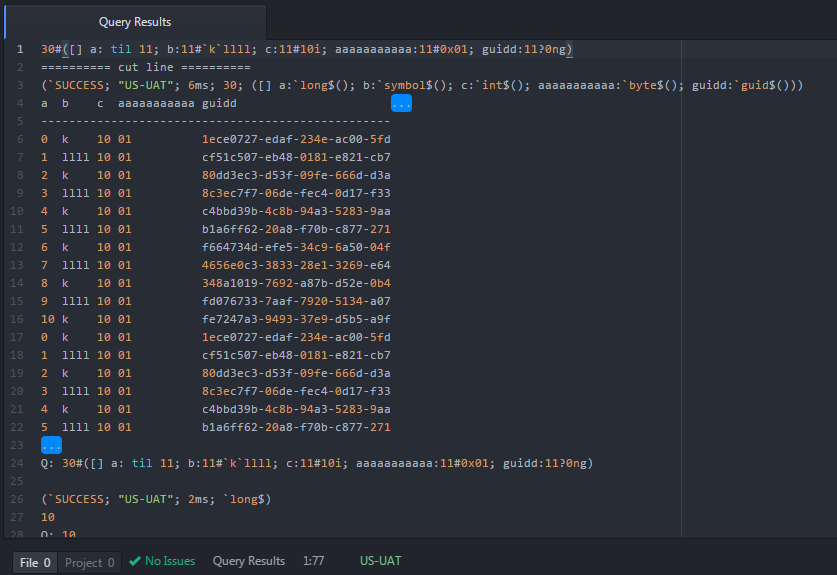
Notice that the query was executed from within the view.
Printed information includes: status, the server, query execution time, number of rows and table prototype.
Then the table itself is printed. connect-kdb-q tries to imitate Q console when it shows data.
Finally the query itself is printed. If it takes more than one row it is automatically folded.
Below you can see the previous query.
Notice the blue markers on the image. They indicate that there is more data to be printed. You can put cursor into one of these markers and data will be added. Lets click on the first marker:
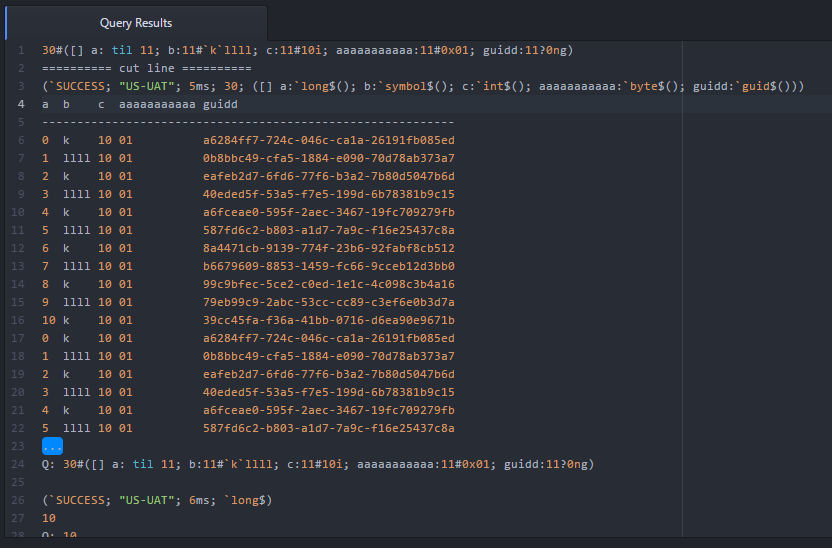
You see that some data was added on the right. Notice also that GUID is now recognized by Q grammar.
If you click on the second marker additional rows will be printed. Each time you click on a marker the current 'show' number of additional rows or columns is shown.
If you enter CLEAR on the first line of the result view the result view will be cleared on every query.
Finally it is worth noting that you can save the query view as an ordinary file.