- Introduction
- Data
- Methods
- Results
- Conclusion
- Requirements
- Installation
- How to Run
- Data Access
- How to Cite
This repository contains the research and findings of our study on the automated detection of pulmonary edema from chest X-ray images using advanced machine learning techniques. Pulmonary edema, a condition characterized by fluid accumulation in the lungs, is a critical indicator of various underlying health issues, including congestive heart failure. The timely and accurate diagnosis of this condition is crucial for effective patient management and treatment planning.
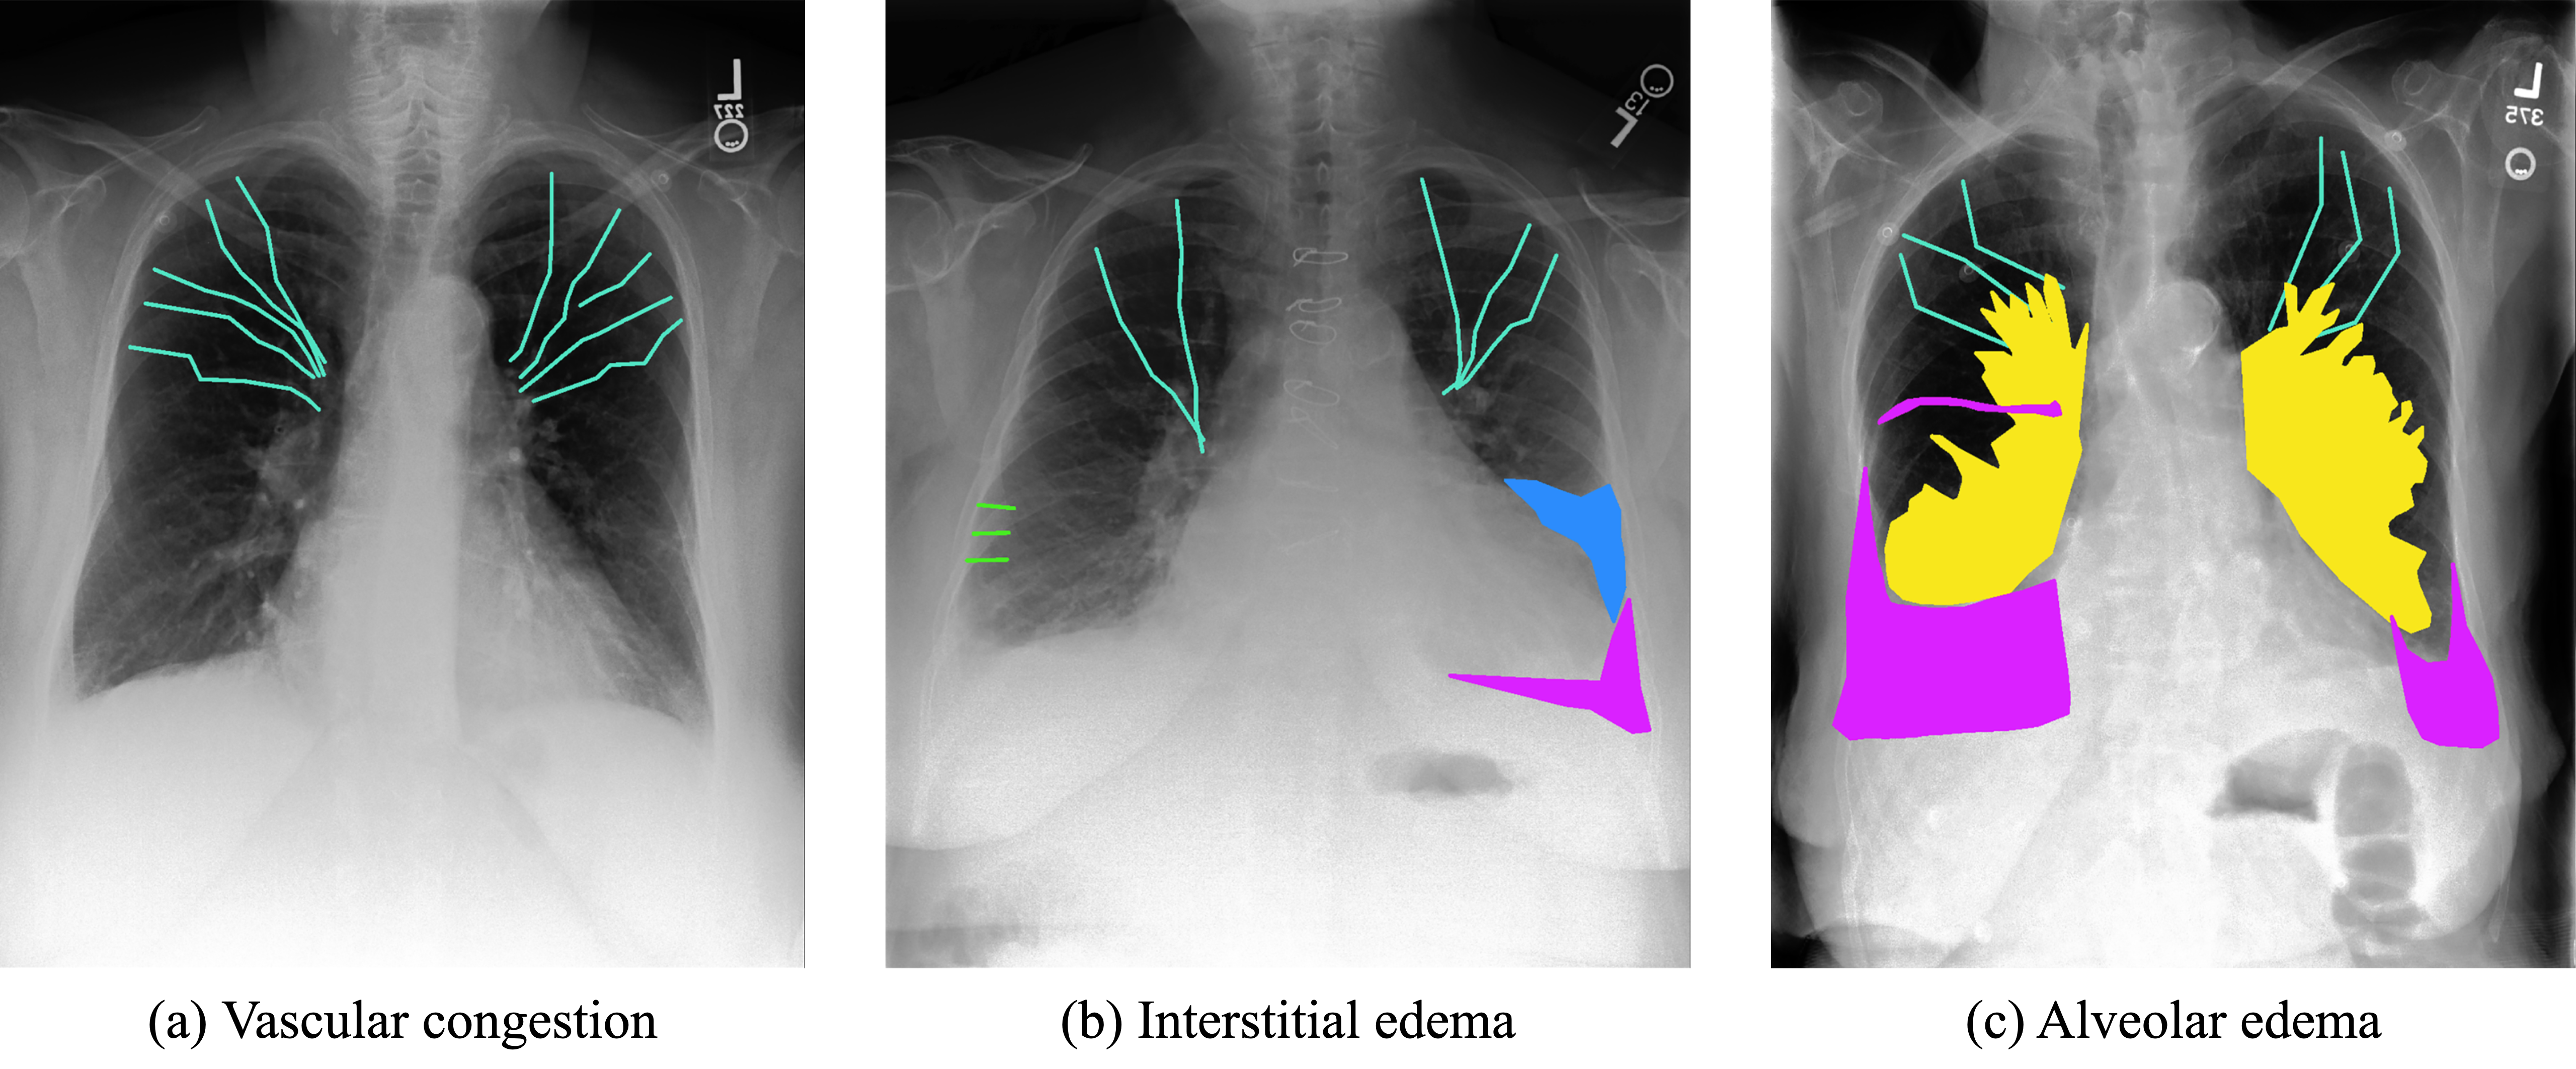
This study utilized a dataset comprised of 1000 chest X-ray images sourced from the MIMIC database, representing 741 patients suspected of having pulmonary edema. The images were annotated by an expert radiologist, identifying key radiographic signs of edema such as cephalization, Kerley lines, pleural effusion, bat wings, and infiltrates (Figure 1). Each feature was meticulously labeled, employing polylines for cephalization and Kerley lines, and segmentation masks for pleural effusions, infiltrates, and bat wings. The selection of 1000 cases was based on a balance between dataset size and the practicality of managing annotation resources and computational demands, ensuring a robust dataset for model training and evaluation. The annotation process was facilitated using the Supervisely platform, emphasizing the detailed and patient-centric approach in dataset preparation.
Figure 1. Annotation methodology for chest X-rays. Various radiological features indicative of pulmonary edema are meticulously annotated for comprehensive analysis. Cephalization, representing the redistribution of blood flow in the upper lung fields, is delineated by cyan polylines. Kerley lines, indicating interstitial edema, are represented by green lines. Pleural effusions, characterized by accumulation of fluid in the pleural space, are highlighted in purple areas. Infiltrates, indicating alveolar edema or inflammation, are visualized by blue areas. Finally, bat wings, suggesting a butterfly pattern of alveolar edema, are highlighted in yellow areas. This detailed annotation method provides essential visual cues for accurate detection and analysis of radiological features.
The methodology employed in this study encompasses two main stages: lung segmentation and edema feature detection (Figure 2). The lung segmentation stage utilized an ensemble of three distinct neural networks to enhance segmentation accuracy. After segmentation, eight object detection networks were employed for edema feature localization. Each network was rigorously evaluated based on their average precision (AP) and mean average precision (mAP) to ascertain their effectiveness in accurately identifying and localizing radiographic features indicative of pulmonary edema. This dual-stage approach, integrating lung segmentation with targeted feature detection, represents a comprehensive strategy for identifying pulmonary edema from chest X-rays.
The segmentation stage was crucial for accurately delineating lung boundaries, leveraging an ensemble approach to combine the strengths of multiple segmentation models such as DeepLabV3, MA-Net, and FPN. This step ensured the precise extraction of lung regions, which is foundational for effective feature detection.
In the detection stage, the study evaluated eight different object detection networks, each with their strengths in identifying specific features of pulmonary edema. The following networks were used: TOOD, GFL, PAA, SABL, FSAF, Cascade RPN, ATSS, and Faster R-CNN. The performance of these networks was measured using AP and mAP metrics, providing a quantitative basis for comparing their effectiveness.
Figure 2. Schematic representation of the proposed approach. The original CXR is fed into the first segmentation stage where a lung mask is predicted. The CXR is then cropped using the lung mask and is further fed into detection stage to identify radiological features that can be used for further clinical analysis.
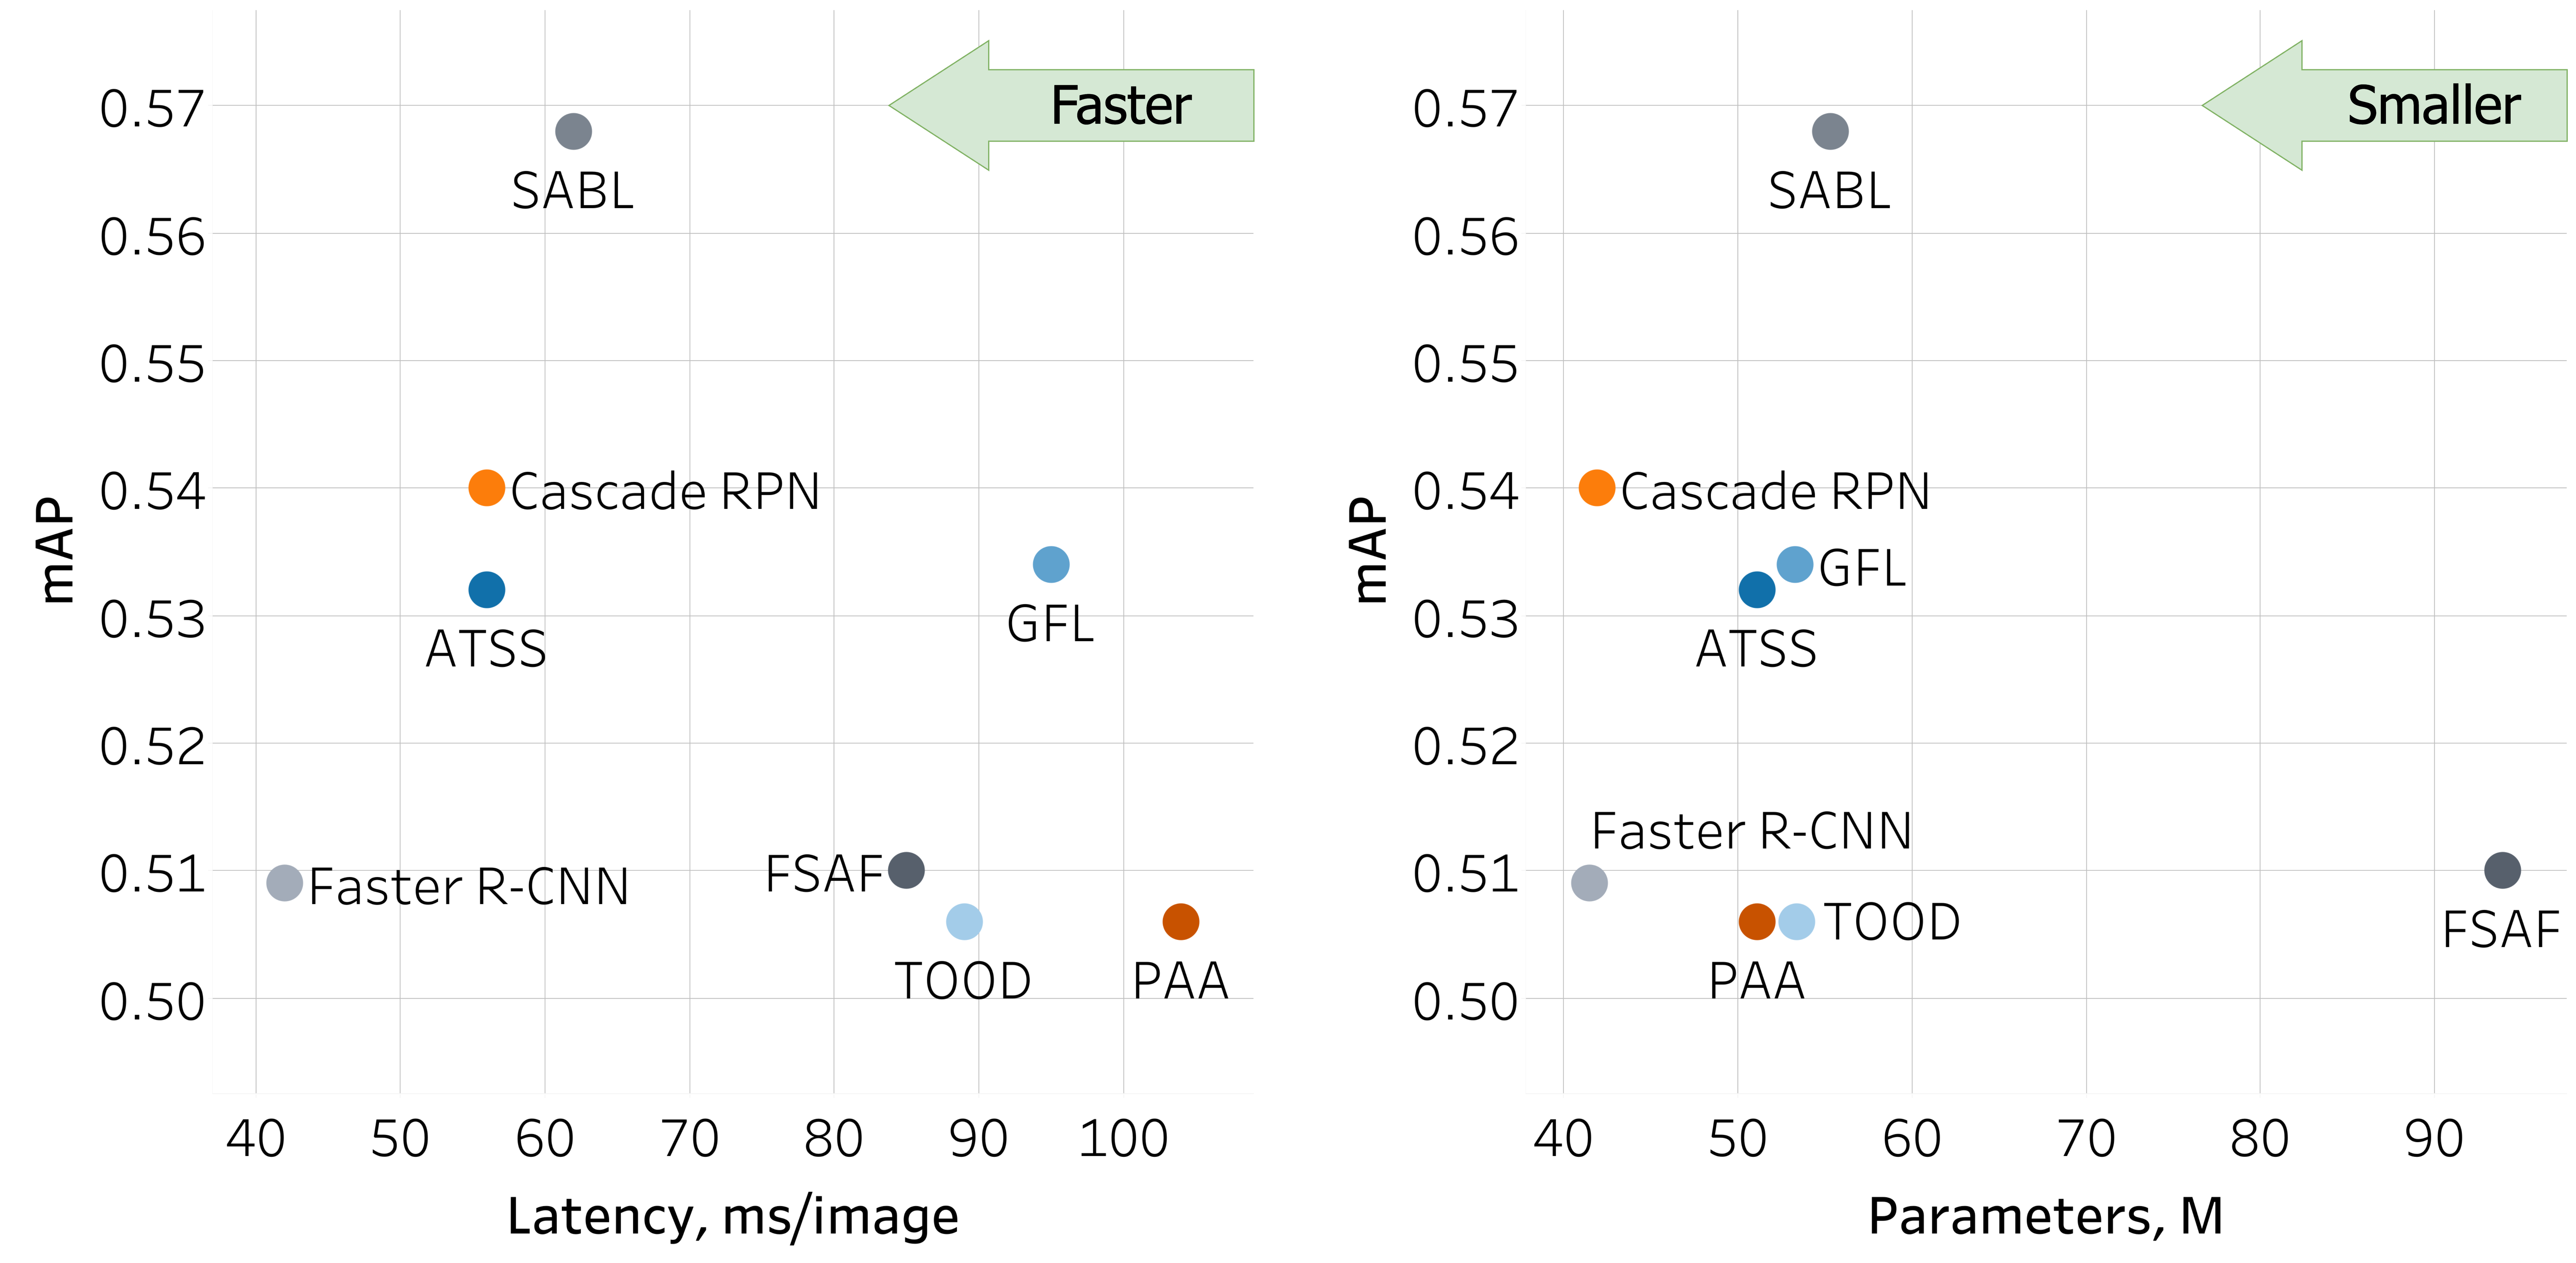
The SABL model emerged as the top performer, achieving the highest mAP of 0.568 and excelling in the detection of effusion, infiltrate and bat wings (Figure 3). Notably, the TOOD model demonstrated robust capabilities, particularly excelling in bat wing detection with an AP score of 0.918. The Cascade RPN and GFL models maintained consistently strong performance across all features. The PAA and FSAF models exhibited balanced performance, achieving mAP scores of 0.506 and 0.510, respectively. Surprisingly, the baseline Faster R-CNN model delivered competitive results with an mAP of 0.509. In addition, we evaluated the latency of these models, revealing processing times ranging from 42 ms to 104 ms per image. These latency values provide valuable insight into the real-time efficiency of each model, enhancing our understanding of their practical utility.
Figure 3. Comparison of the networks based on their mAP scores, latency, and the number of parameters.
 |
 |
|---|---|
| (a) Bat | (b) Effusion |
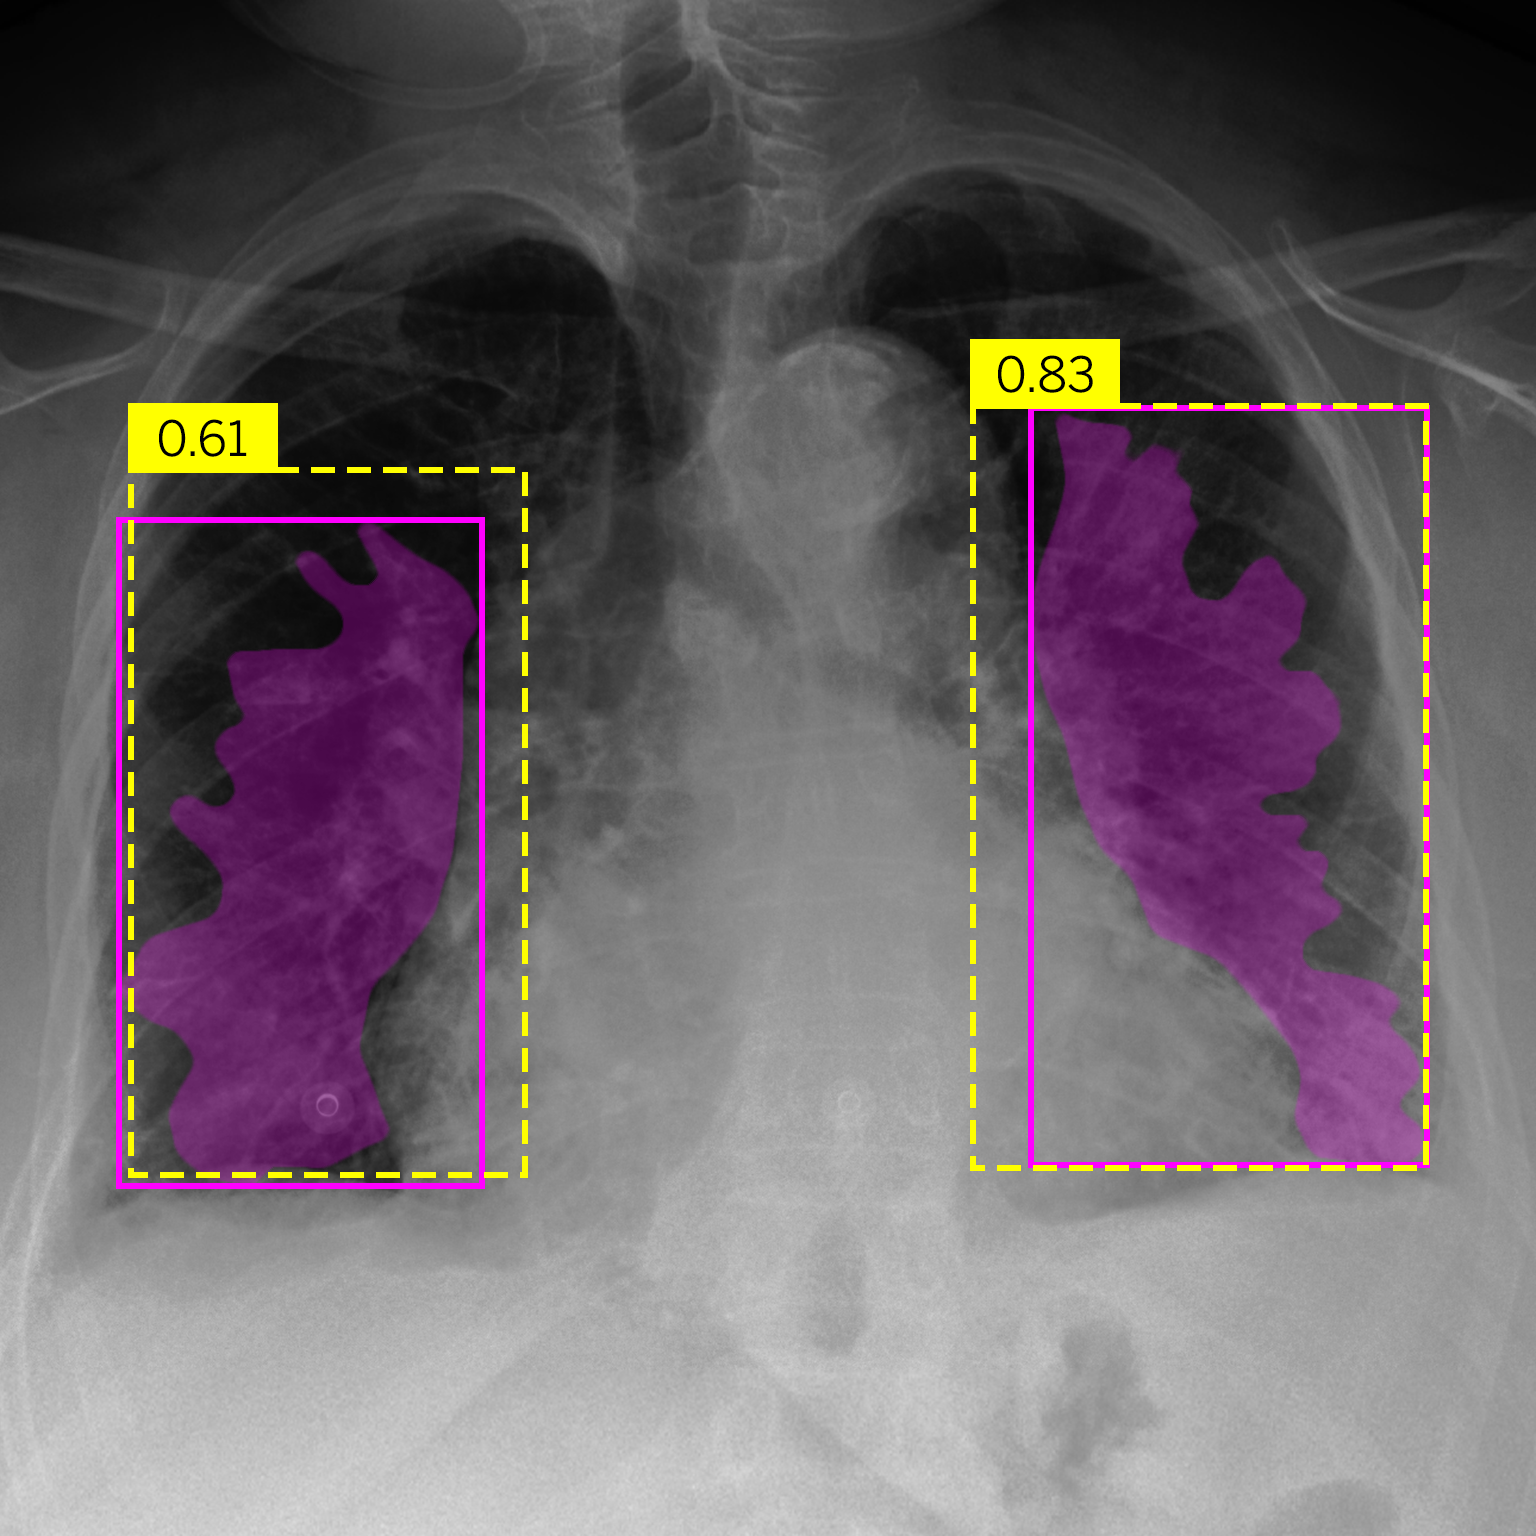
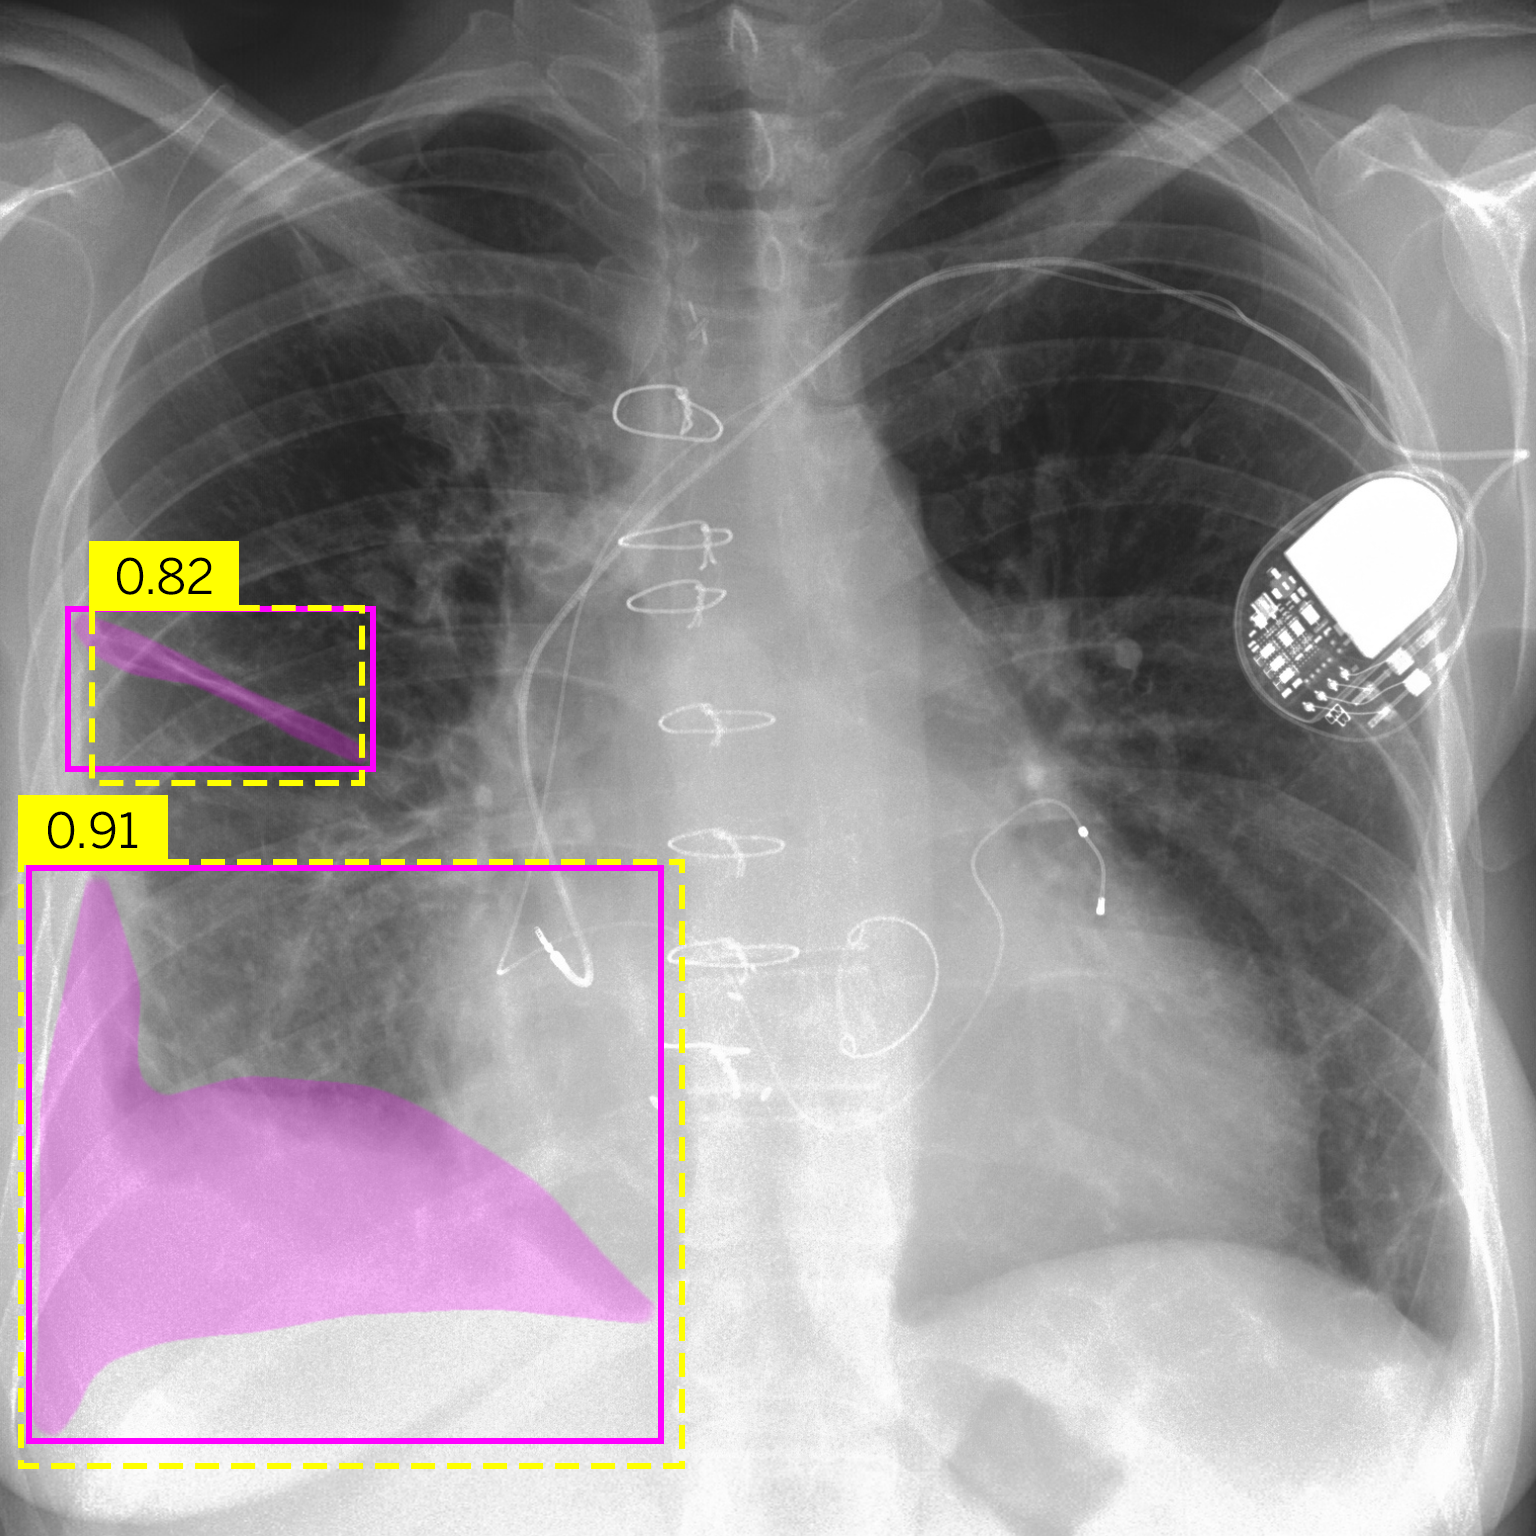
Figure 4.Comparison of predictions and their confidences: ground truth (purple boxes and masks) vs. network predictions (yellow boxes).
The proposed methodology effectively highlighted and classified pulmonary edema features, positioning it as a promising candidate for the development of a clinical support tool aimed at assisting radiologists in the diagnosis and severity assessment of pulmonary edema.
- Operating System
- macOS
- Linux
- Windows (limited testing carried out)
- Python 3.8.x
- Required core packages: dev.txt
Step 1: Download and install Miniconda
wget https://repo.anaconda.com/miniconda/Miniconda3-py38_22.11.1-1-Linux-x86_64.sh
chmod +x Miniconda3-latest-Linux-x86_64.sh
./Miniconda3-latest-Linux-x86_64.sh
Step 2: Clone the repository, create a conda environment, and install the requirements
git clone https://github.com/quantori/edema-quantification.git
cd edema-quantification
chmod +x create_env.sh
source create_env.shSpecify the data_dir and save_dir parameters in the predict.yaml configuration file. By default, all images within the specified data_dir will be processed and saved to the save_dir directory.
To run the pipeline, execute predict.py from your IDE or command prompt with:
python src/predict.pyAll essential components of the study, including the curated dataset and trained models, have been made publicly available:
- Dataset: https://zenodo.org/doi/10.5281/zenodo.8383776
- Models: https://zenodo.org/doi/10.5281/zenodo.8393565
Please cite our paper if you found our data, methods, or results helpful for your research:
Danilov V.V., Makoveev A.O., Proutski A., Ryndova I., Karpovsky A., Gankin Y. (2024). Explainable AI to identify radiographic features of pulmonary edema. Radiology Advances. DOI: https://doi.org/10.1093/radadv/umae003


